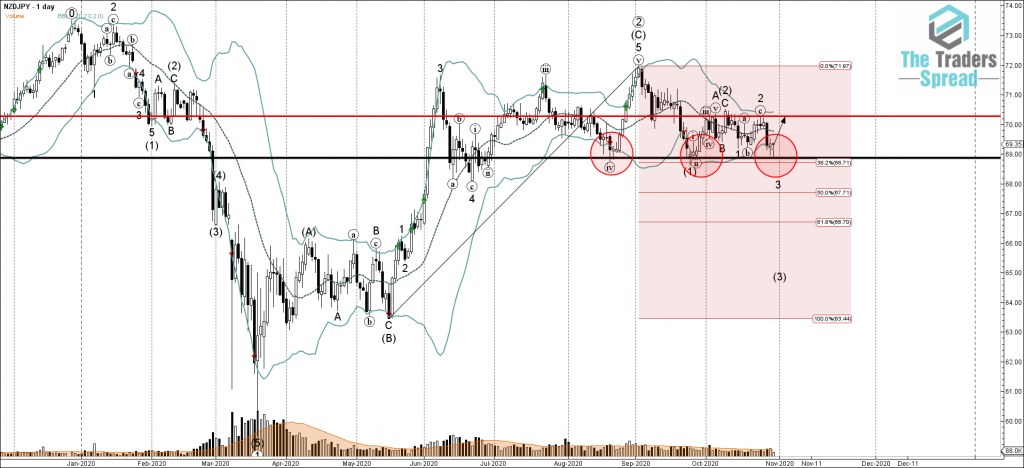
- NZDJPY reversed from support area
- Likely to rise to 70.30
NZDJPY continues to rise after the earlier upward reversal from the support area lying between the key support level 69.00 (which has been reversing the price from the middle of August, as can be seen from the daily NZDJPY chart below), lower daily Bollinger Band and the 38.2% Fibonacci correction of the previous sharp upward impulse wave (C) from the middle of May.
Considering the strength of the aforementioned support area – NZDJPY is expected to rise further toward the next resistance level 70.30 (which formed the top of the previous short-term correction 2 and of the previous waves (iii), A and C, as can be seen below).
Was this post helpful?
Let us know if you liked the post. That’s the only way we can improve.

