
• NZDCAD reversed from support area
• Likely to rise to resistance level 0.9250
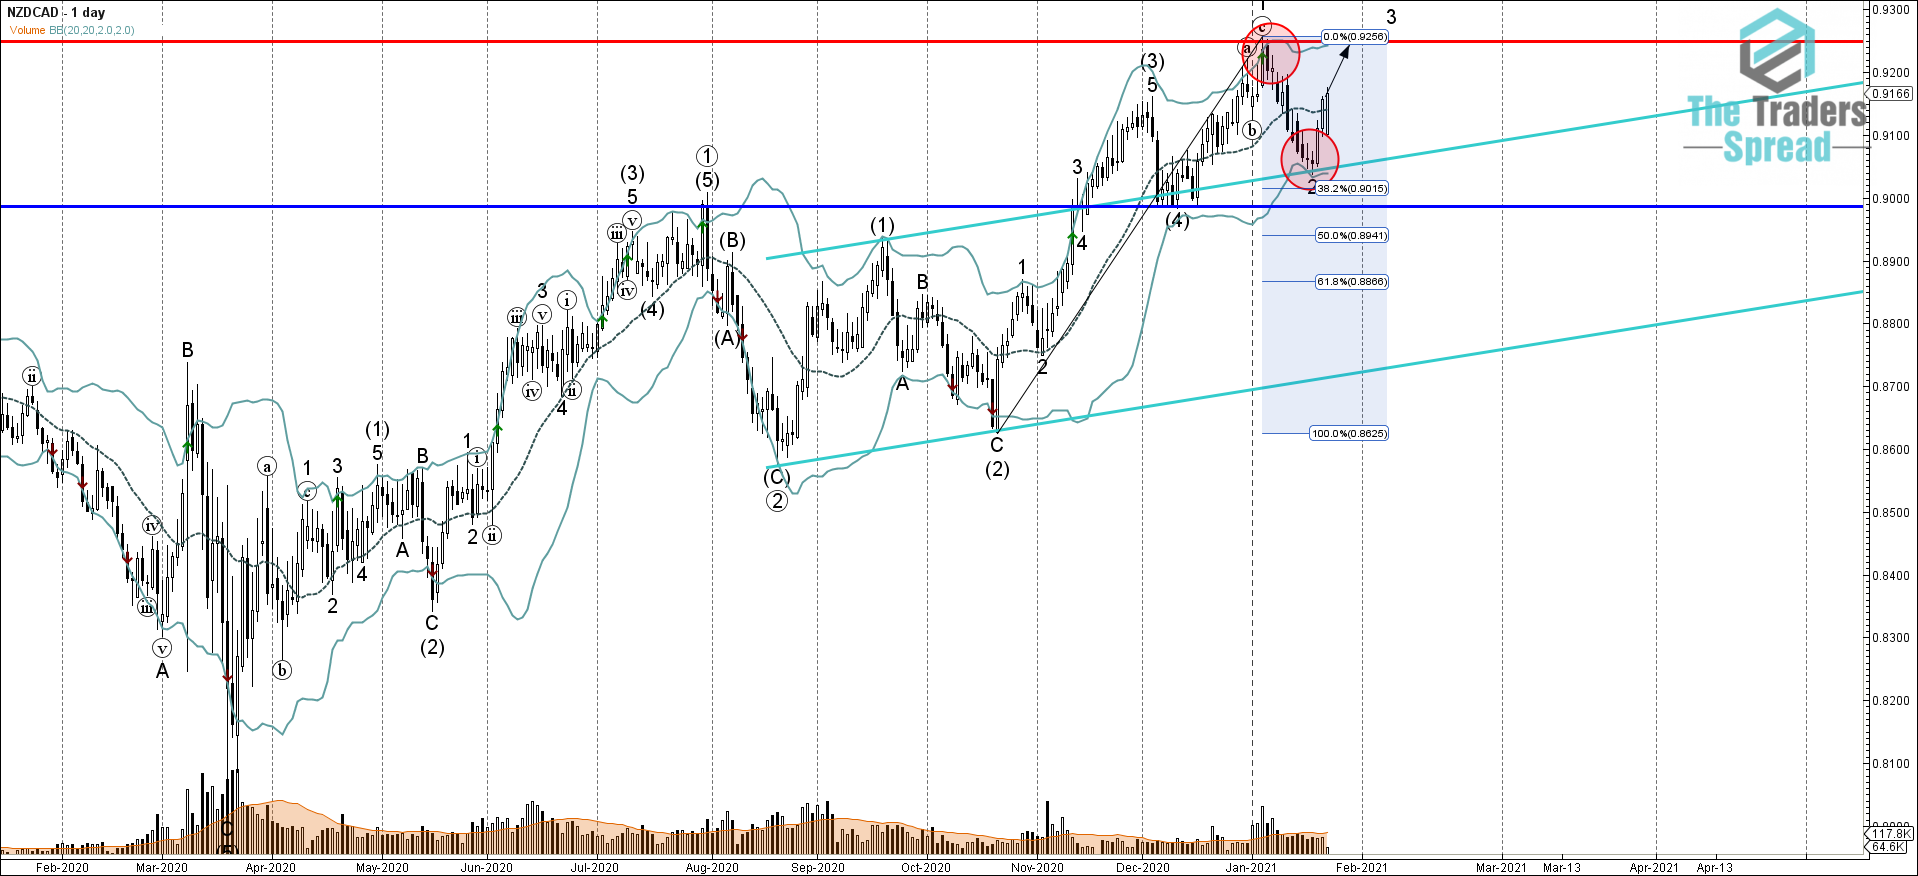
NZDCAD currency pair recently reversed up from the combined support area lying between the key round support level 0.9000 (which stopped the previous medium-term correction (4) in December), upper trendline of the daily up channel from the middle of August, lower daily Bollinger Band and the 38.2% Fibonacci correction level of the previous sharp upward impulse from the middle of October.
Given the strong uptrend that can be seen on the daily NZDCAD charts – NZDCAD currency pair is likely to fall further in the active impulse waves 3 and (5) toward the next resistance level 0.9250 (top of the previous impulse wave 1).
Was this post helpful?
Let us know if you liked the post. That’s the only way we can improve.


