- NZDCAD broke resistance area
- Likely to rise to 0.9100
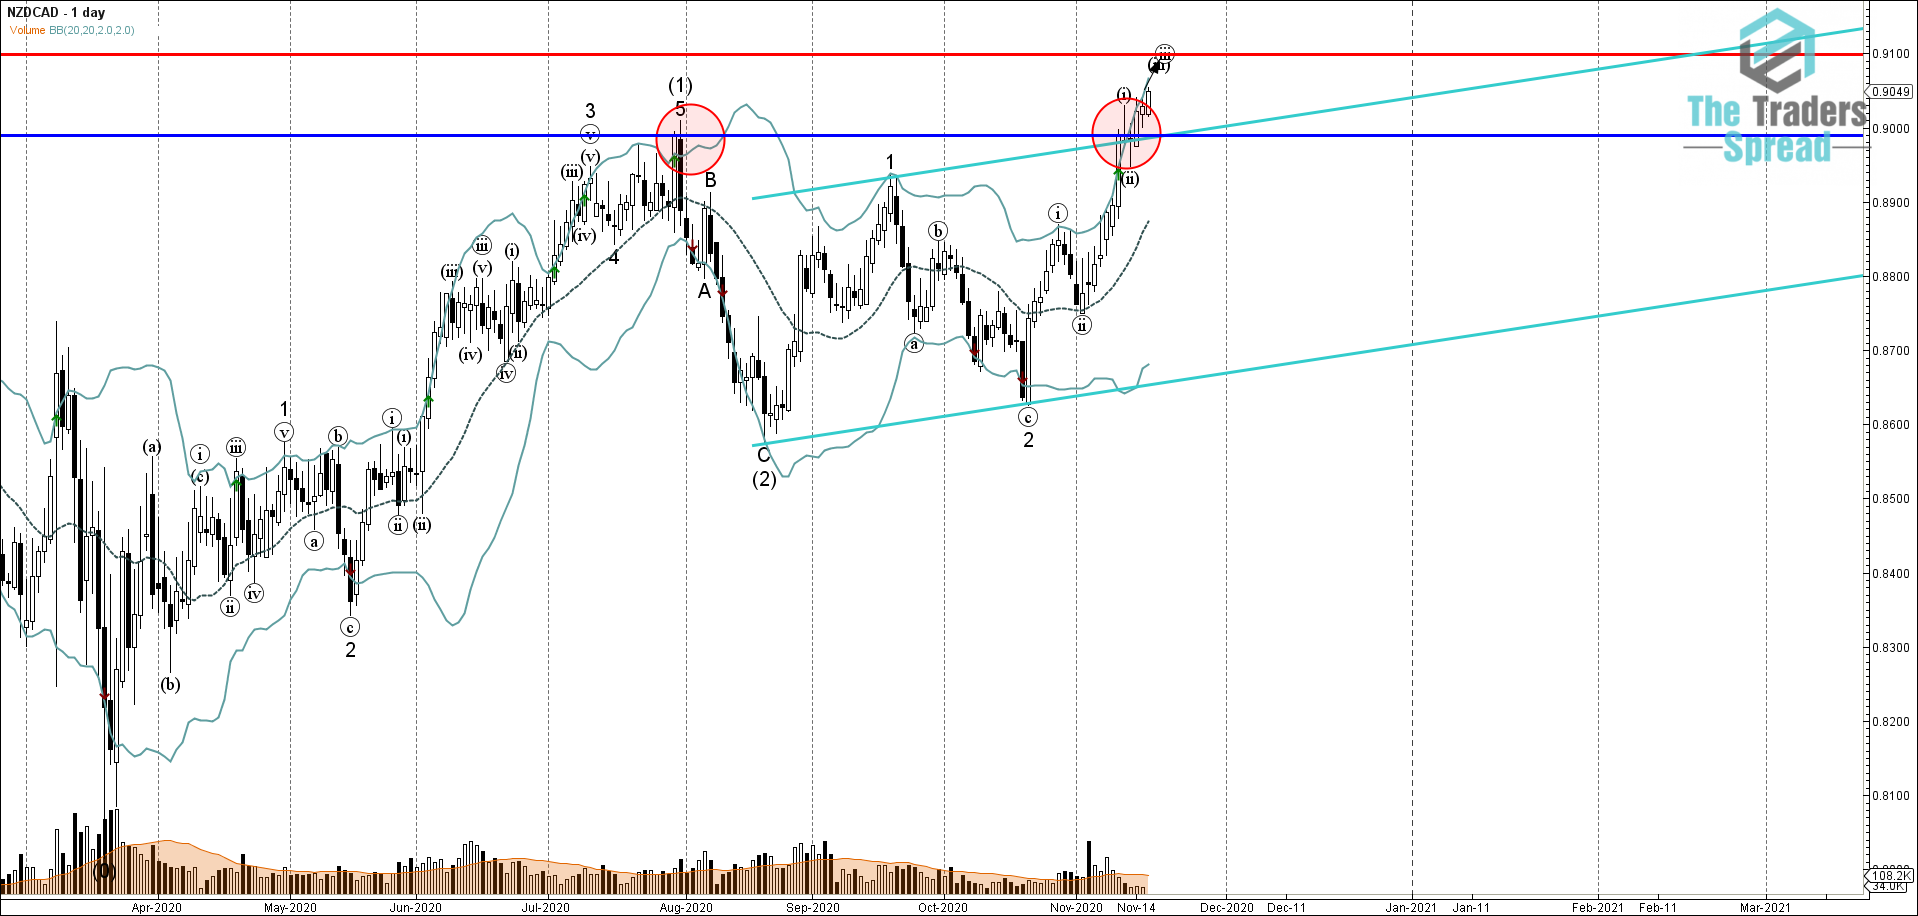
NZDCAD continues to rise fall after the earlier breakout of resistance area lying at the intersection of the resistance level 0.9000 (which stopped the previous sharp upward impulse (1) at the end of July, as can be seen form the daily NZDCAD chart below) and the daily up channel from Augist. The breakout of this resistance area accelerated the active upward impulse sequences (iii) and 3 – which belong to the medium-term impulse wave (3) from August.
Given the strong long-term uptrend inside which NZDCAD has been moving from the start of the year and the strengthened NZD bullishness on risk-on sentiment – NZDCAD is likely rise further toward the next resistance level 0.9100 (target price calculated for the completion of the active impulse wave (iii)). Strong support now stands at the support level 0.9000.