• NZDCAD reversed from support area
• Likely to reach resistance level 0.9110
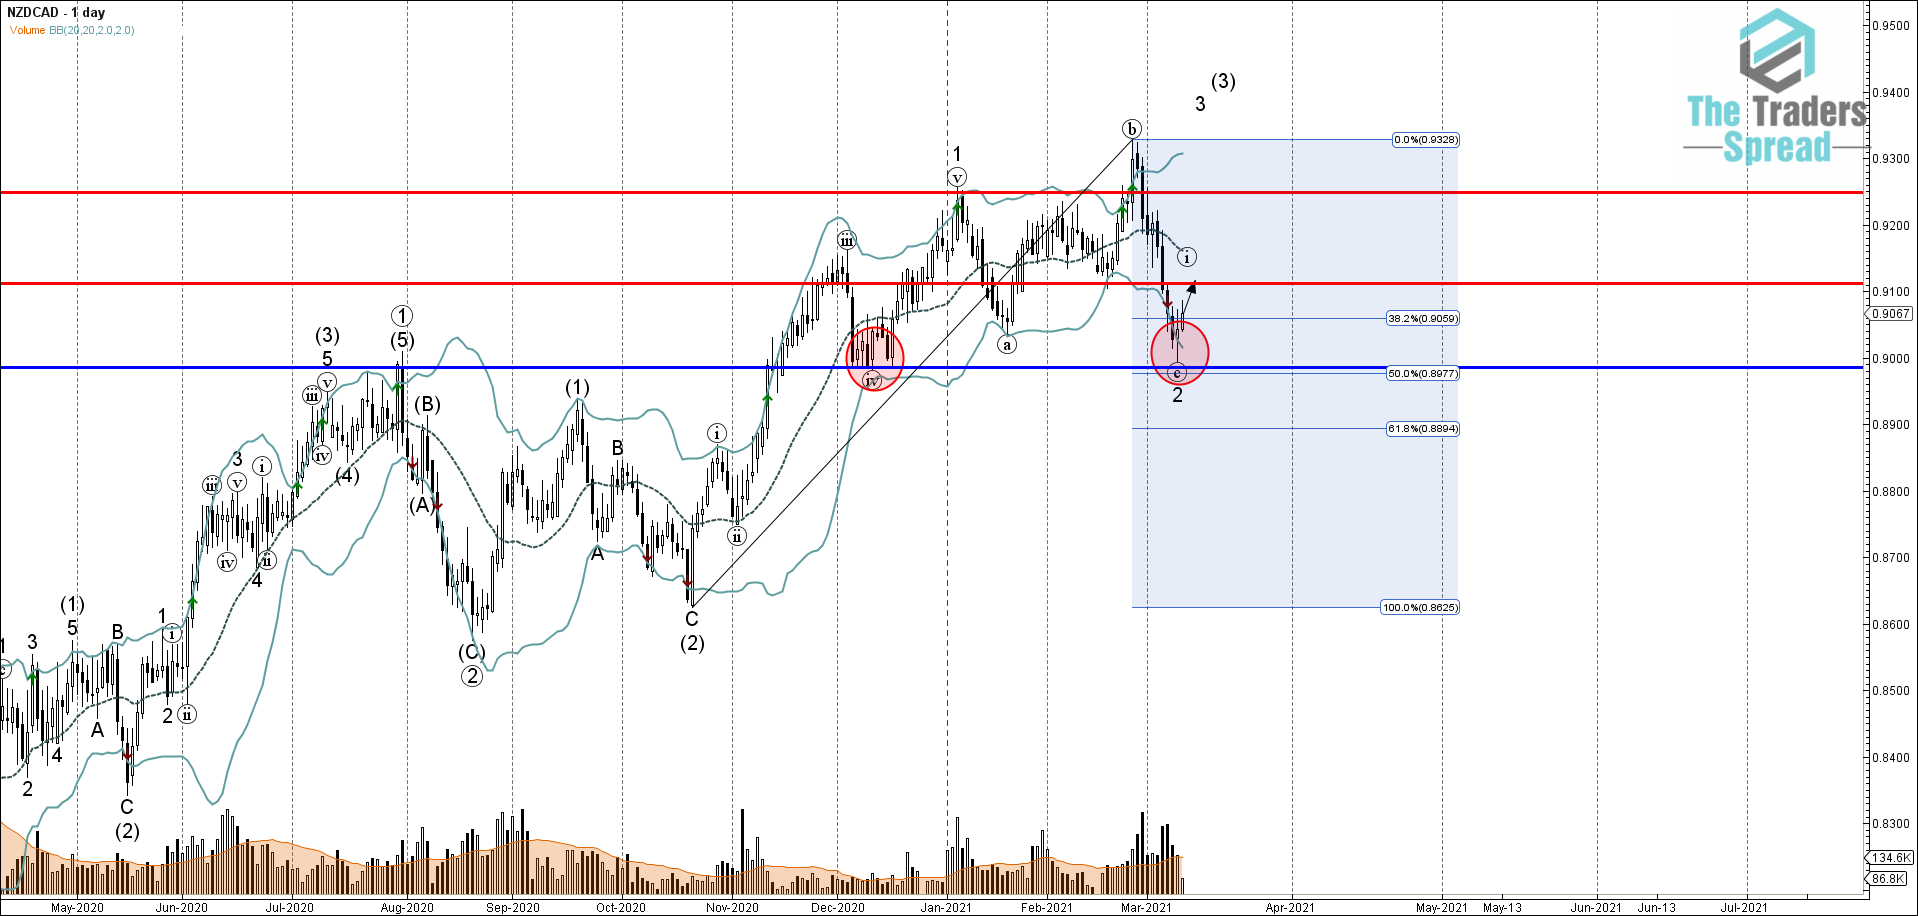
NZDCAD currency pair recently reversed up from the support area lying between the key support level 0.8985 (which reversed the price multiple times in December – as can be seen from the daily NZDCAD chart below), lower daily Bollinger Band and the 50% Fibonacci correction of the upward impulse from October. The upward reversal from this support area started the active short-term impulse wave 3 – which belongs to the intermediate impulse wave (3) from last October.
Given the persistent daily uptrend and the continued bullish sentiment affecting the new Zeeland dollar – NZDCAD currency pair is likely to rise toward the next resistance level 0.9110 (former monthly low from the middle of December).