
• NZDCAD reversed from support zone
• Likely to rise to resistance level 0.8715
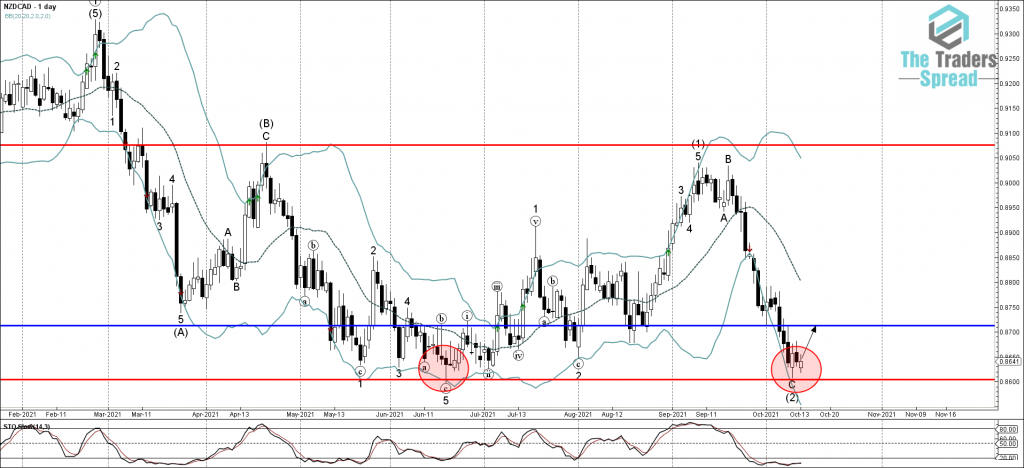
NZDCAD currency pair recently reversed up from the support zone lying between the key, multi-month support level 0.8600 (previous multi-month low from the middle of June) and the lower daily Bollinger Band. The upward reversal from this support zone started the active medium-term impulse wave (3).
Given the strength of the aforementioned support zone and the oversold reading on the daily Stochastic indicator, NZDCAD currency pair can be expected to rise further toward the next resistance level 0.8715 (former resistance from the end of September).
Was this post helpful?
Let us know if you liked the post. That’s the only way we can improve.


