
• Natural gas broke resistance zone
• Likely to rise to resistance level 4.000
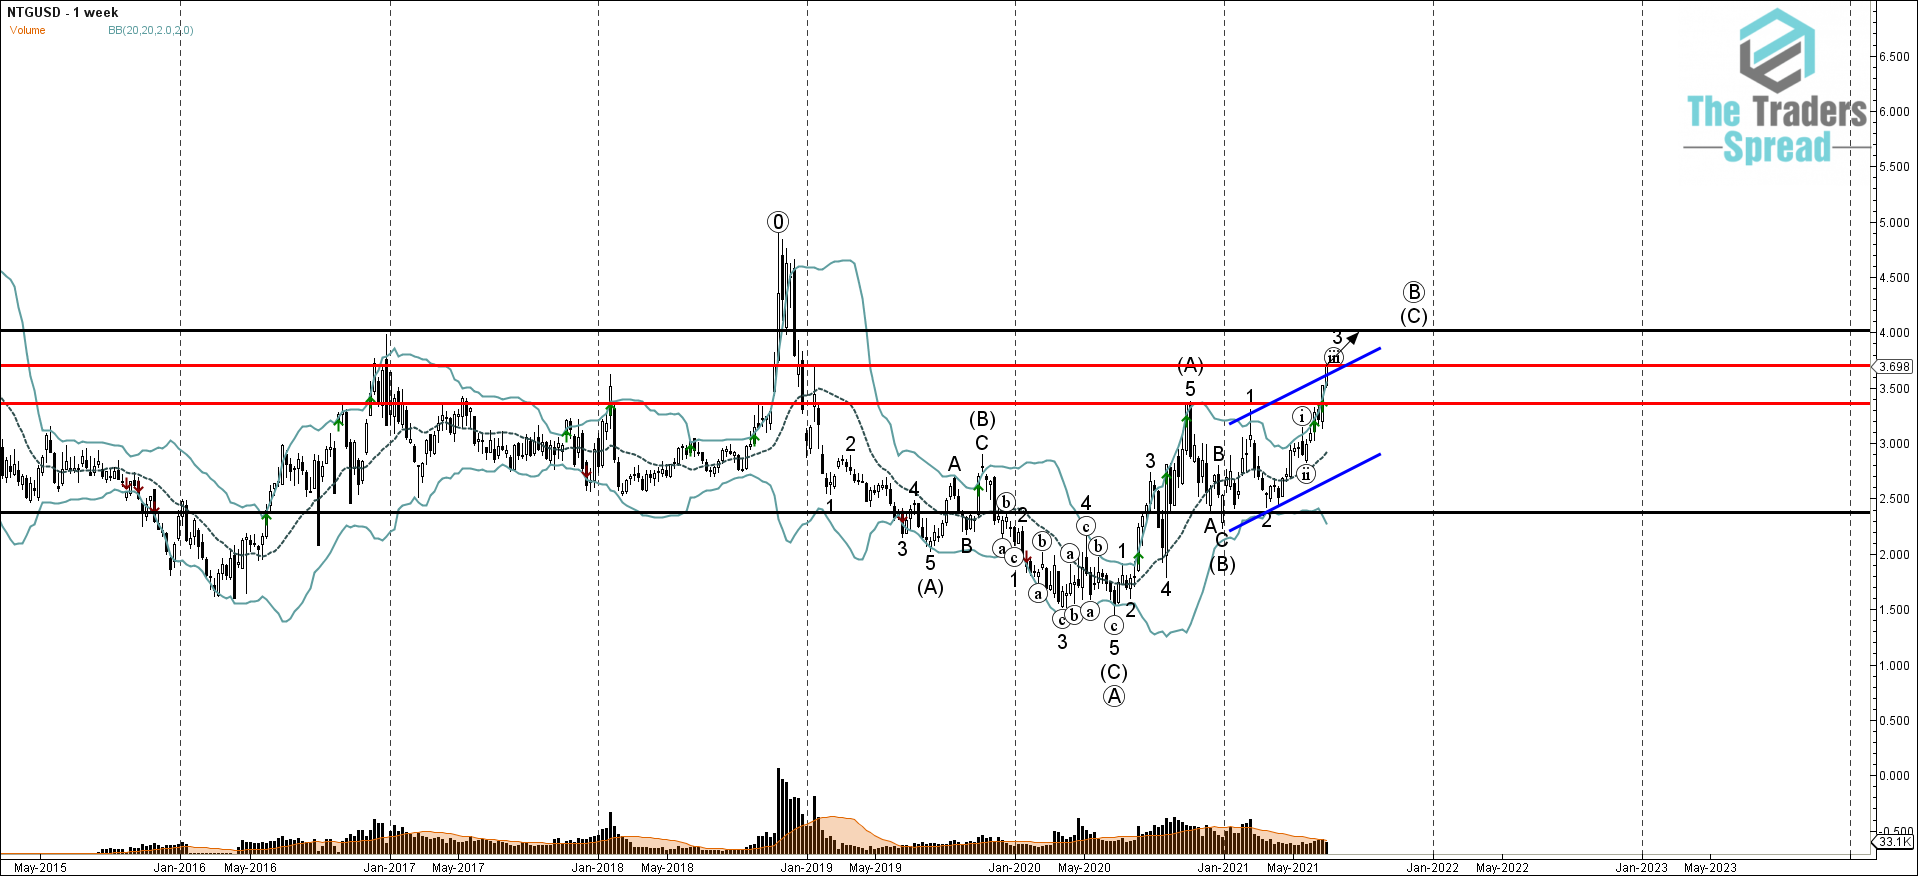
Natural gas continues to rise after the price broke through the resistance zone lying between the key resistance level 3.70 (former January high from 2019 as can be seen from the weekly Natural gas chart below) and the resistance trendline of the weekly up channel from the end of last year. The breakout of this this resistance zone should accelerate the active impulse waves 3 and (C)
Given the clear uptrend that can be seen on the weekly charts – Natural gas can be expected to rise further toward the next round resistance level 4.000 (target price for the completion of the active impulse wave (C)).
Was this post helpful?
Let us know if you liked the post. That’s the only way we can improve.


