• Natural gas reversed from support area
• Likely to reach resistance level 2.640
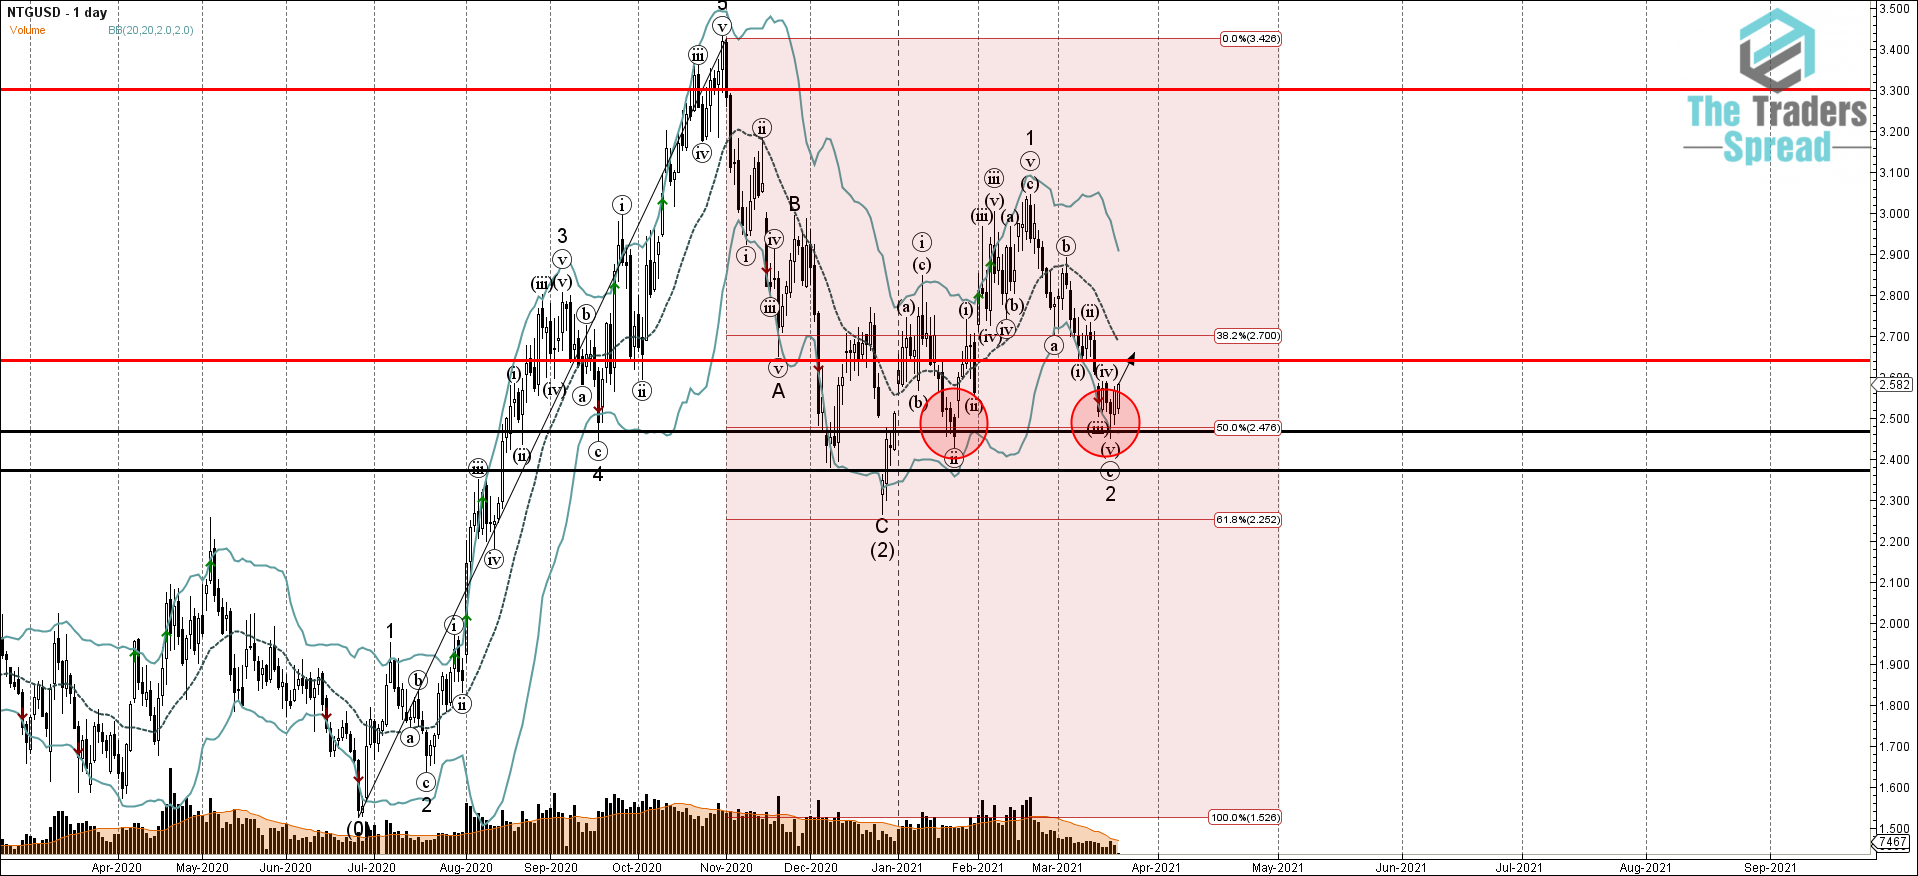
Natural gas recently reversed up from the support area located between the key support level 2.466 (former monthly low from the middle of January), lower daily Bollinger Band and the 50% Fibonacci correction of the pervious upward impulse from the end of last June. The upward reversal from this support area created the daily Japanese candlesticks reversal pattern Hammer– which stopped the previous short-term ABC correction 2 from February.
Given the strength of the support level 2.466 and the projected continuation of the cold winter period toward the next of this month – Natural gas can be expected to rise further toward the next minor resistance level 2.640 (former support from the start of March).