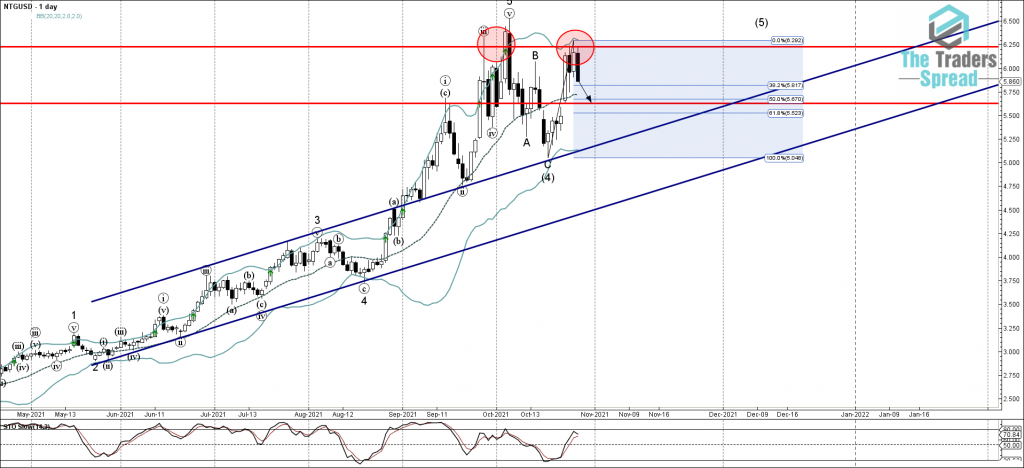
• Natural gas reversed from resistance zone
• Likely to fall to support level 5.630
Natural gas recently reversed down from the resistance zone lying between the pivotal resistance level 6.25 (which has been reversing the price from the end of September, as can be seen from daily Natural gas chart below) and upper daily Bollinger band. The downward reversal from this resistance zone is currently forming the second consecutive Japanese candlesticks reversal pattern – Bearish Engulfing.
Given the strength of the aforementioned resistance zone and the bearish divergence on the daily Stochastic indicator, Natural gas can be expected to fall further toward the next support level 5.630 (former powerful resistance from September).


