• Natural gas reversed from support area
• Likely to rise to resistance level 4.160
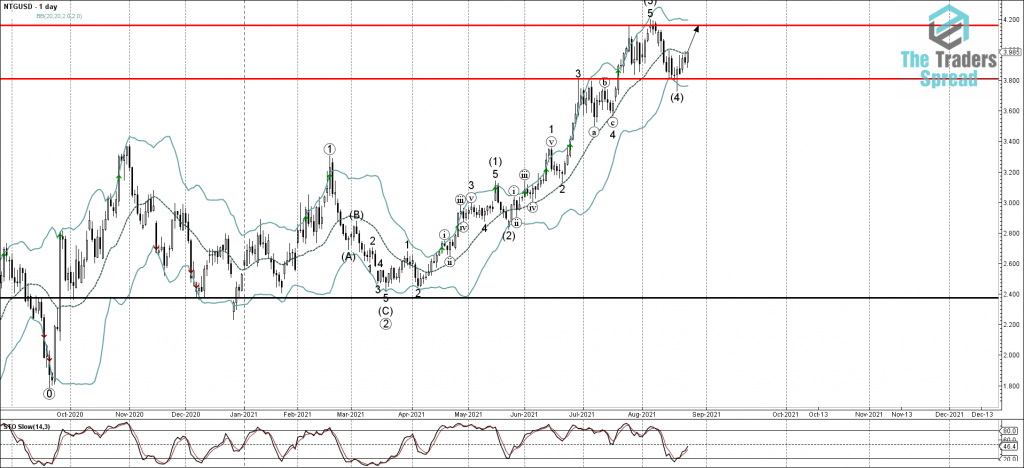
Natural gas recently reversed up from the support area located between the pivotal support level 3,800 (former powerful resistance from the end of June – acting as the support after it was broken in the middle of July) and the lower daily Bollinger Band. The upward reversal from this support zone created the daily Hammer reversal pattern, which started the active medium-term impulse wave (5), aligned with the prevailing uptrend.
Considering the strong uptrend, Natural gas can be expected to rise further toward the next resistance level 4.160 (which has been reversing the price from the end of July, stopping the earlier impulse wave (5)).


