
• Natural gas broke daily down channel
• Likely to rise to resistance level 6.335
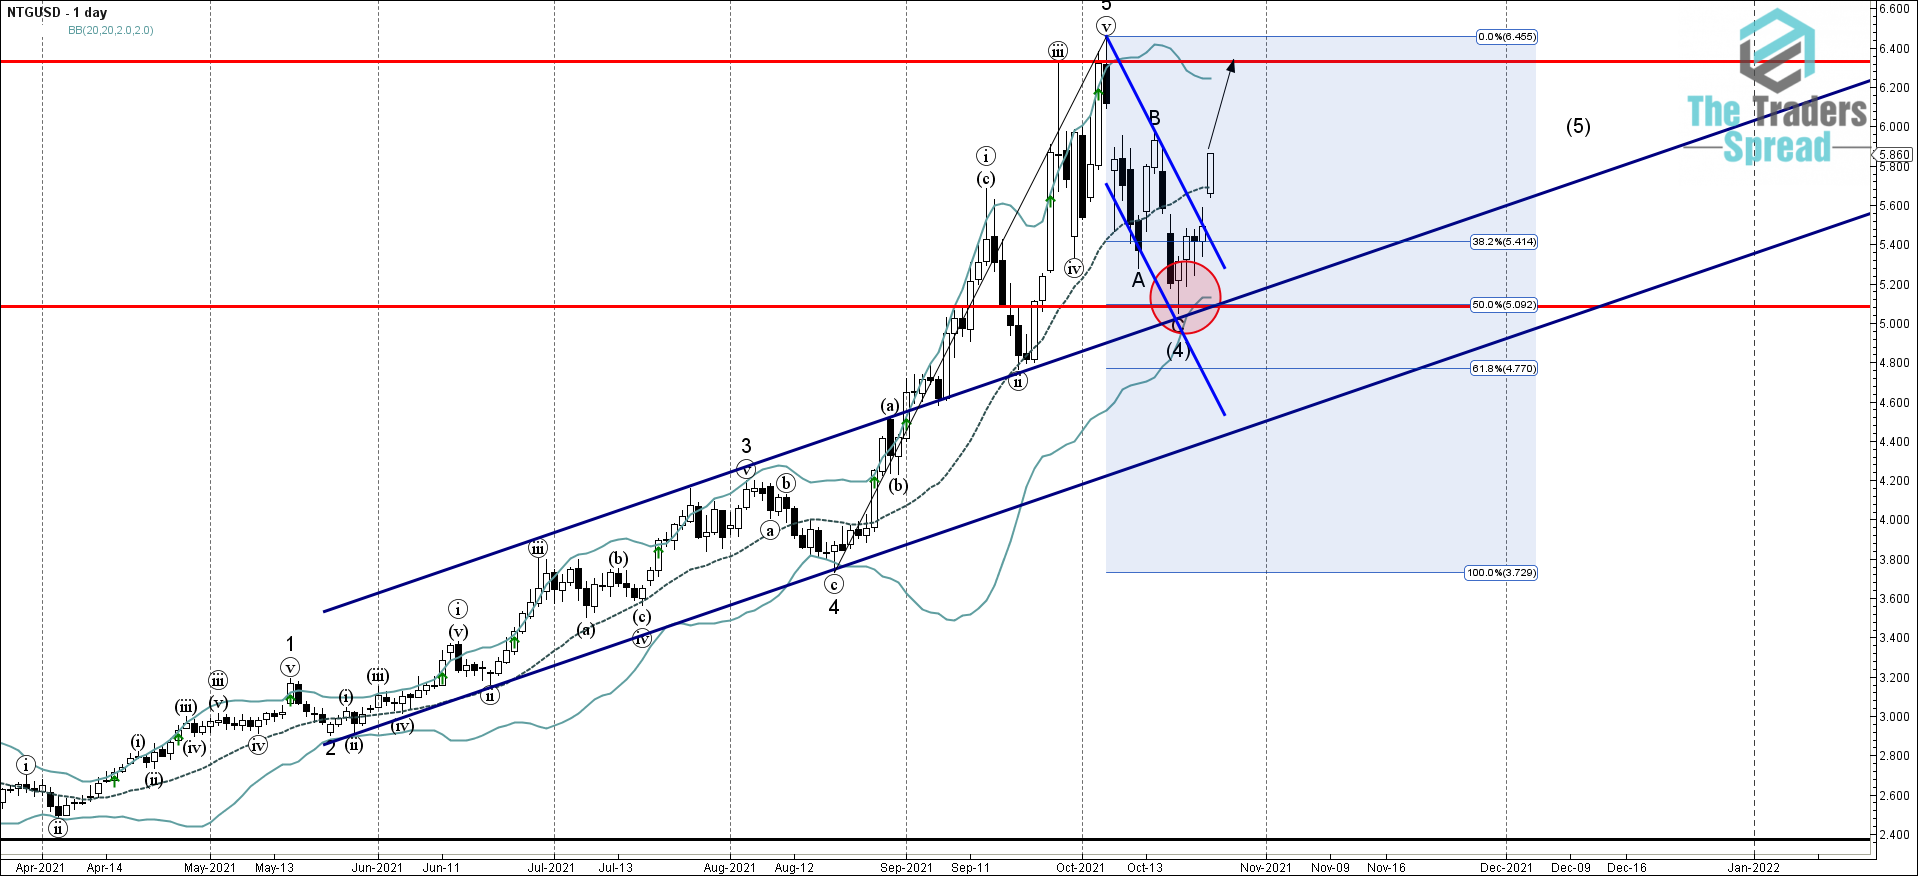
Natural gas continues to rise after the price broke the resistance trendline of the daily down channel from the start of October (which closed the previous intermediate ABC correction (4) as can be seen from the daily Natural gas chart below). The breakout of this down channel accelerated the active intermediate impulse wave (5)- which started earlier from the 50% Fibonacci correction of the previous sharp upward impulse wave from August.
Given the predominant daily uptrend, Natural gas can be expected to rise further toward the next resistance level 6.335 (which stopped the previous sharp upward impulse waves (iii) and 5).
Was this post helpful?
Let us know if you liked the post. That’s the only way we can improve.


