
• Natural gas reversed from support zone
• Likely to rise to resistance 5.9
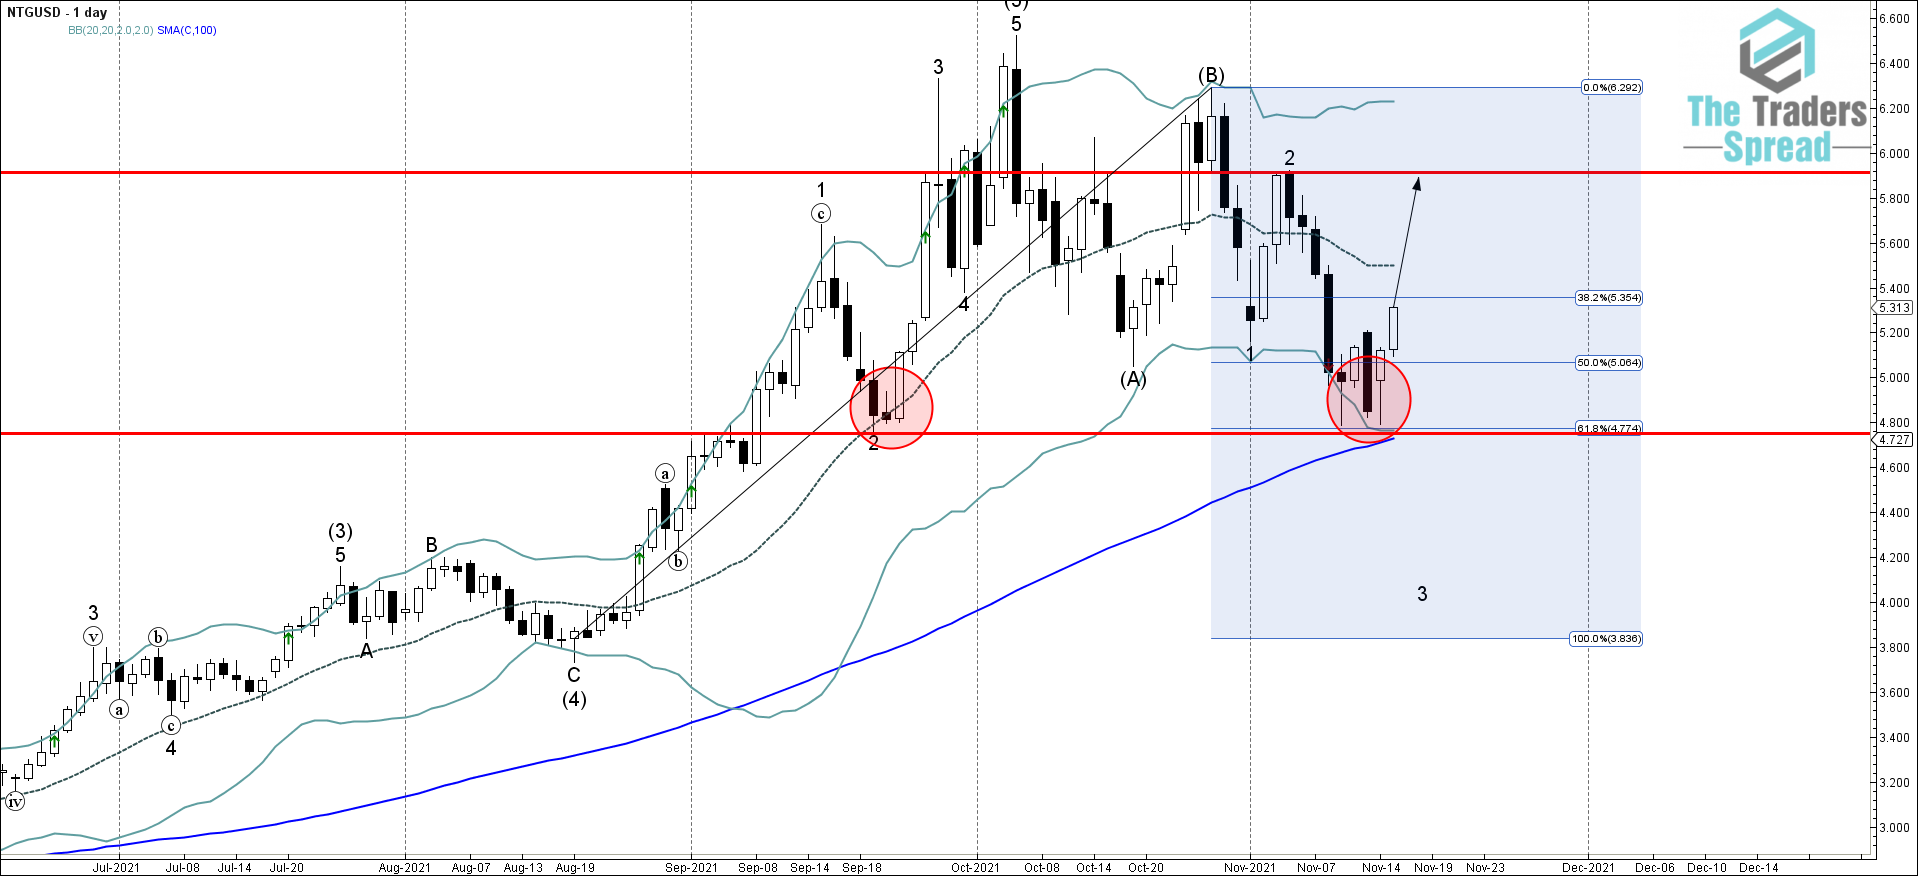
Natural gas recently reversed up from the support zone lying between the key support level 4.800 (which has been reversing the price from the middle of September, as can be seen from the daily Natural gas chart below), lower daily Bollinger Band and the 61.8% Fibonacci correction of the upward impulse from August and the 100-day moving average. The upward reversal from this support zone is aligned with the clear daily uptrend.
Given the improvement in risk sentiment as seen across the commodities markets today, Natural can be expected to rise further toward the next resistance level 5.9 (top of the previous minor correction 2 from the start of November).
Was this post helpful?
Let us know if you liked the post. That’s the only way we can improve.


