
• Natural gas reversed from support zone
• Likely to rise to resistance level 5.2500
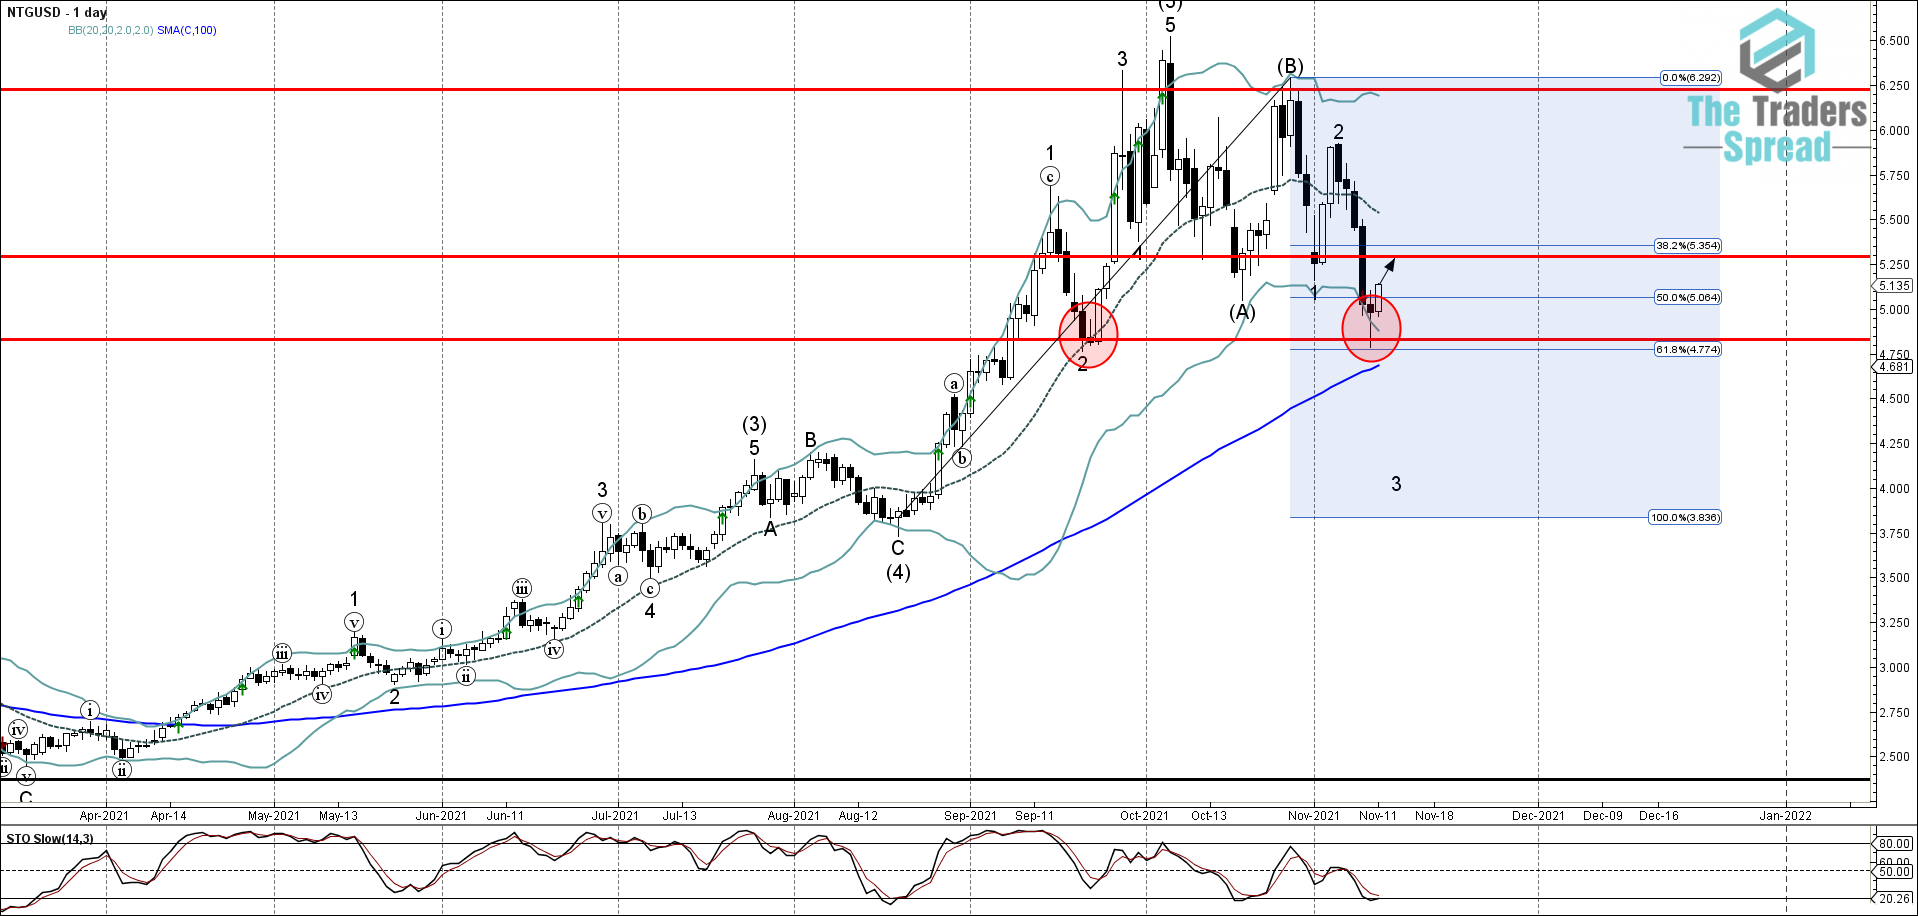
Natural gas continues to rise after reversing up from the support zone lying between the key support level 4.831 (pervious low of wave 2 from the end of September), lower daily Bollinger band and the 61.8% Fibonacci correction of the extended upward impulse from the middle of August. The upward reversal from this support zone created the daily Japanese candlesticks reversal pattern Hammer.
Given the clear daily uptrend, Natural gas can be expected to rise further toward the next resistance level 5.2500 (former support from the end of October – which stopped the previous minor impulse wave 1).
Was this post helpful?
Let us know if you liked the post. That’s the only way we can improve.


