• Nasdaq100 reversed from support area
• Likely to rise to resistance level 13600.00
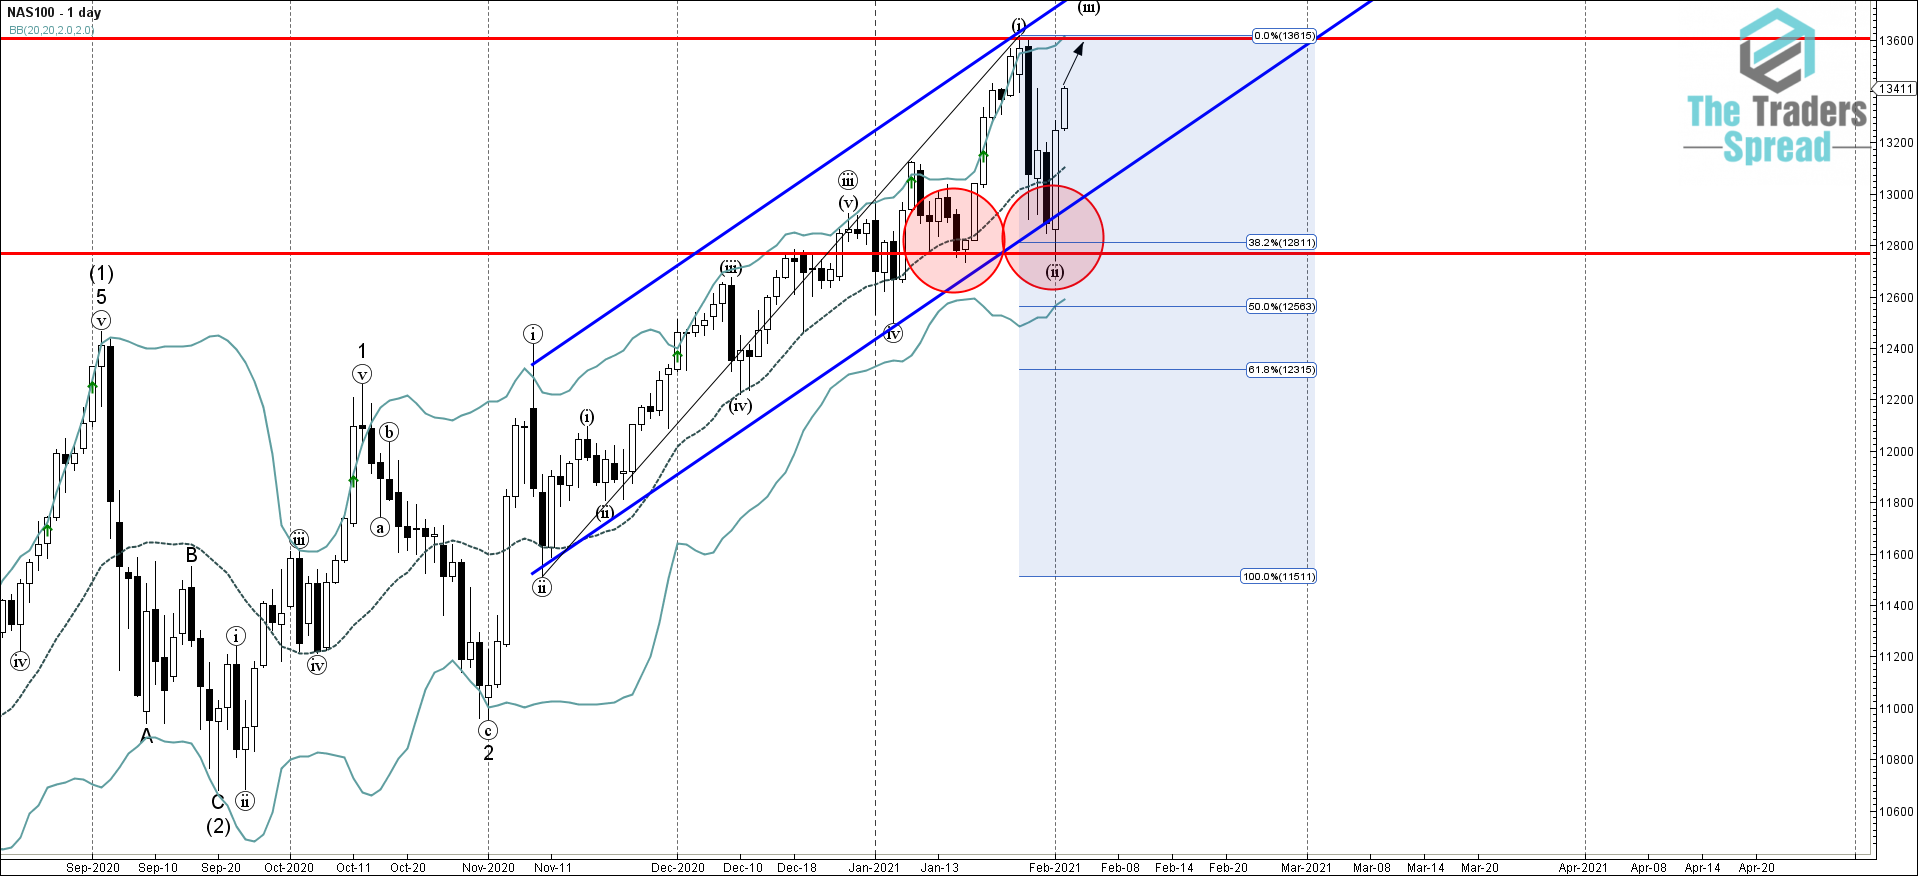
Nasdaq100 index continues to rise steadily after the price reversed up with the daily Japanese candlestick reversal pattern Bullish Engulfing form the combined support area lying between the key support level 12770.00 (which has been steadily reversing the price from the start of January), support trendline of the daily up channel rom November, lower daily Bollinger Band and the 38.2 %Fibonacci correction of the upward impulse from November.
Given the clear uptrend that can be seen on the Nasdaq100 charts – the price can be expected to rise further in the active impulse waves (iii) and 3 toward the next resistance level 13600.00 (top of the pervious minor impulse wave (i) from the end of January).