Summary: Despite a very dovish message from the Federal Reserve, markets are in a risk-off mode. Yesterday, the U.S. dollar was strengthening the most since March 19, while the S&P 500 index experienced its biggest drop since March 16, and Treasury yields were heading toward all-time lows. The risk of a second wave building in the U.S. and some other countries, like Israel, combined with the confirmation that a V-shaped recovery was a vain hope served as a trigger to the market sell-off.
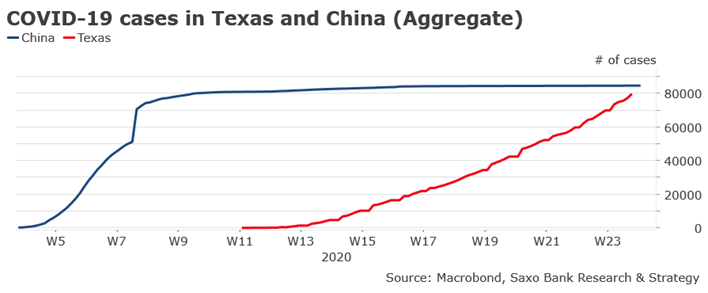
There are more and more indications that the U.S. will probably not avoid a second wave. The latest statistics from the state health department confirm the intuition that many U.S. states relaxed containment measures too early. In California, Florida, Georgia, and Texas, the seven-day average rates of new cases are at or near record highs, while in Arizona and Oregon, new cases have strongly increased over the past month. The case of Texas is very interesting since it is one of the main states to first lift containment measures.
According to the official figures released yesterday, it recorded 2,504 new cases – the highest one-day total since the outbreak started. The total count climbed by 3,2% versus a seven-day average of 2,2% to 79,757 cases – which represents almost the official number of cases in China (85,393 as of today). Other countries are also facing similar risks of a second wave, such as Israel, where new cases among foreign workers have considerably increased in recent days, prompting the government to introduce strict quarantine measures in certain neighborhoods.
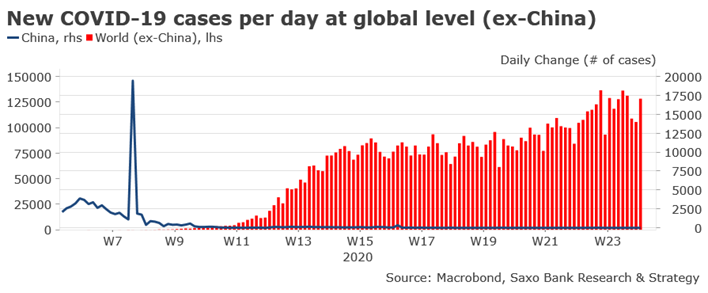
Though the pandemic seems to be contained in Europe, with the exception of the U.K., it continues to spread fast at the global level, with 128,408 new cases recorded yesterday – one of the highest daily figures since the beginning of March. Uncertainty about the pandemic will remain one of the main downside risks to the equity market in the coming months and will continue to weight very negatively on many sectors, first and foremost, the tourism and the aviation sectors.
The same problem of interpretation arises with typical diffusion surveys, such as the German ZEW. We have seen over the past few weeks a strong jump in expectations in various diffusion surveys. This jump does not mean confidence is back. Investors need to keep in mind that those questioned are merely asked to compare with how expectations are relative to the past month. Expectations are improving, but this is mostly because they cannot be worse – they are improving from an utter stand-still!
Investors will have to learn to navigate in a more uncertain economic environment than ever before. Economic forecasting has been proved to be very difficult in the pandemic. It explains why there is so much divergence between economic forecasts. For instance, the current forecast spread among analysts for Brazil range from -1.8% to -8% this year (based on 36 available GDP forecasts), and for China, it ranges from -3% to +3,5% this year (based on 74 available GDP forecasts).
We observe the same issue with U.S. forecasts. For 2021, the forecast spread between FOMC members has never been that important to my knowledge. The most pessimistic member expects that the economy will be in recession (GDP at -1%) while the most optimistic expects it will grow by +7%. The same gap exists for the unemployment forecast: it could move either to 4.5% or to 12% next year.
Not saying that the market has paid much attention to economic data over the past ten years, but as a matter of fact, it usually strongly guides monetary policy action, which is probably one of the main drivers of the stock market. This major divergence is mostly explained by the fact economic models are not able to integrate the pandemic factor and the inherent economic impact that is massive. Said differently, economists are not epidemiologists, and since we have never faced such a major global pandemic since WWII, we don’t know how it will really affect consumption and investment behavior (e.g., hysteresis effect or not?).
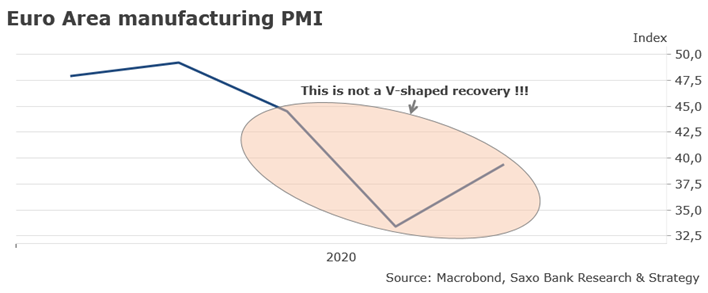
We know the outlook is very grim for the coming months – Q1 GDP was awful, but the worst is still to come with Q2 GDP to be released soon. But we don’t have much clue regarding the shape and the speed of the recovery that will depend on the impact of the second wave and the efficiency of monetary and fiscal policy. Finally, in the long run, the only factor that might really matter for investors in the equity market might be liquidity, and so far, it has been surging.