
The best technical minds are Contrary Thinkers
Event-Based Cycles
The Dow made its peak with the same tidal configuration as previous major highs going back over 120 years. The pattern is as follows: from the first decline after the first top, there is a failed rally attempt at new highs in an average of 37 days. The most recent failed attempt in the Dow ended on March 4, which is 21 days after the peak. The number of days to the first long bar down day greater than 4% was March 9 – 26 days- I have optimized that date to put it outside the arbitrary definition of 23 days needed for the decline to be a bear market, not a correction.
In other words, there was a long bar within the 23 day period from open to close greater than 4%, but it only exceeds the 4% nominally.
The next critical time window presented by this method is the time window for a Short-Term low, all of which should occur from Mid-June into Late July. Now, based on the February 12 peak, the average time frame brings in the S-T low on June 9 with a historical range from May 19 to June 25.
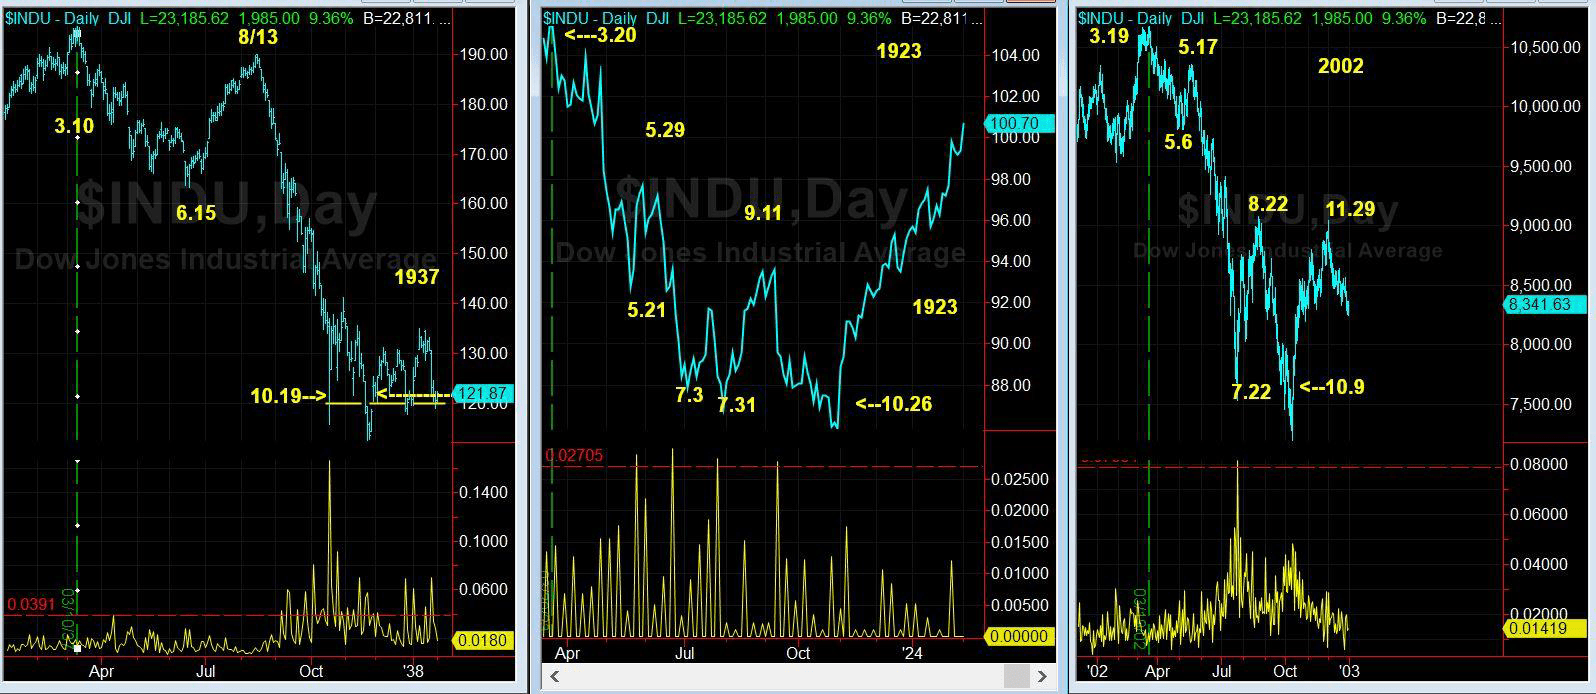
Recovery from that time window, again based on the Event-Based Cycle, leads to a strong rally and peak in August or September, leading to the final washout low in October.
Among six historical peaks occurring in this late February to early April season or time window had identical or opposite tidal angle, the 1937 top and the decline in 1938 fits the character of the all-time high pivot February 12, 2020 by the Dow.
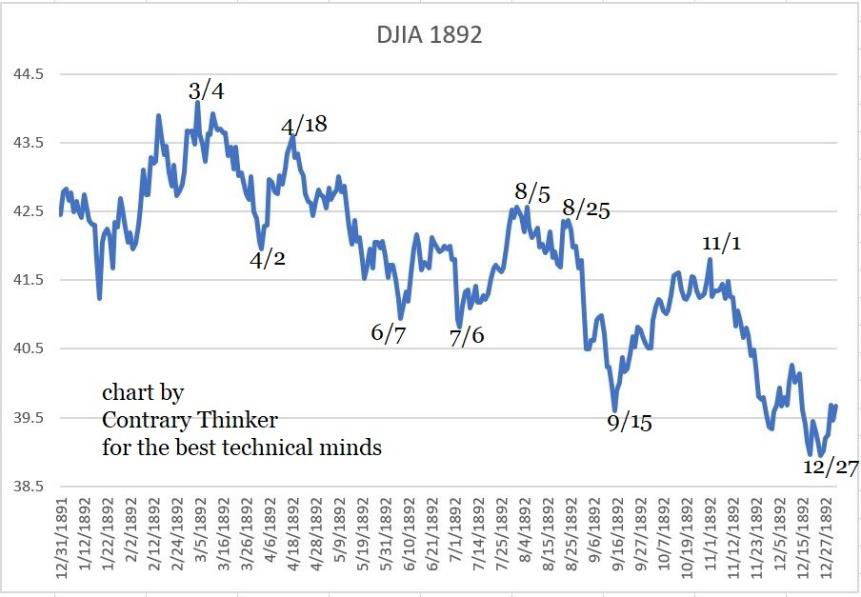 The historical chart seen here shows another peak that happened in February through March season.
It fits the scenario outline above on the 20th-century peaks in March. With a recovery into late summer – August – and a mini panic to a full-blown wash out going into mid- September 1892 but in all the rest October – November.
NOTE: Another item of note is that after the first panic low, there will be a test about 45 days after that creating the textbook “W” or double bottom before a trading rally. More on that in the fall of the year.
MarketMap-2020 Calendar
Contrary Thinker’s calendar for change of trend time windows projects when traders can expect the direction of the market to pivot, each based on different formulas. In the “Volatility Reports,” I pointed out that a low was due on or about March the 10th, the low hit on the 12th.
While the headlines seem dramatic Monday, the 2k decline was only a test of the 24-hour Globex market lows and they held! Suggesting a trading range for now. Walking forward into the next change date starts today into April first based on the above EBC.
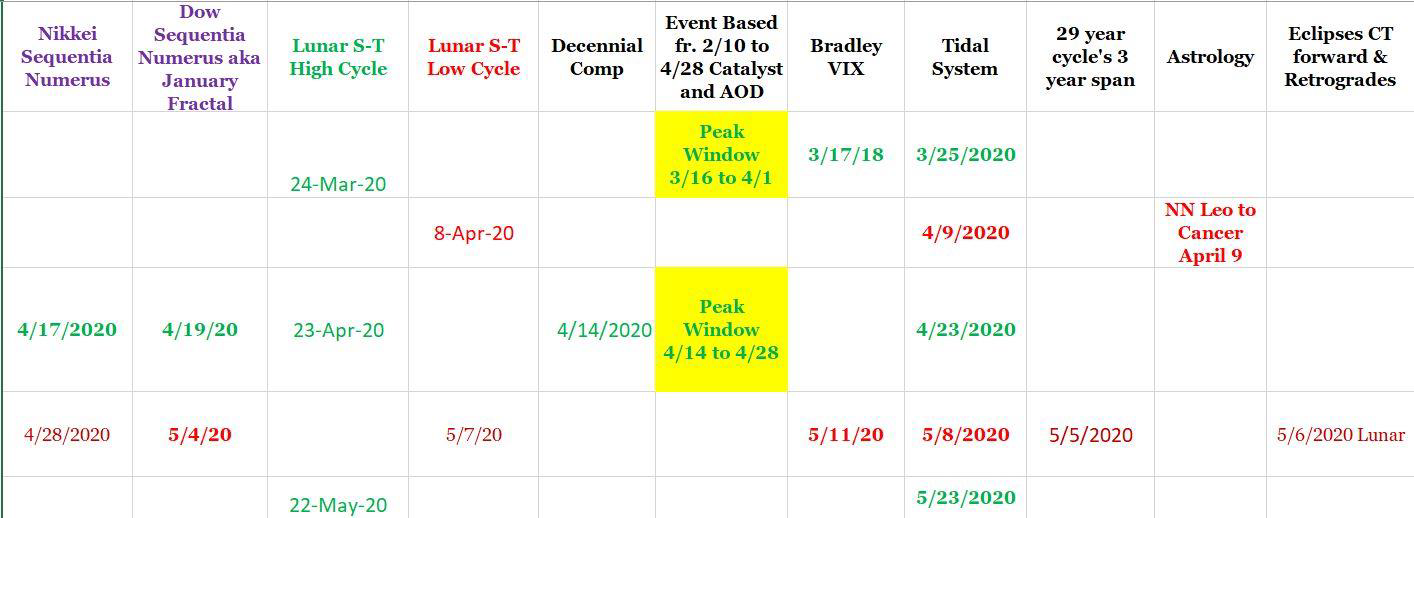
However, TMT’s S-T Tidal system has a pending sell signal on March 24 and 25. This all fits the scenario of a trading range type of rally here before the next leg down into the EBC lows mentioned above, from May 19 to June 25. Please note that in all stock market history that May runs a close second to panic months after October. Stay Tuned to the blog and LinkedIn Group and thank you for your support.
Great and Many Thanks,
Jack F. Cahn, CMT
A Thinking Man’s Trader Since 1989,
Copyright 1989-2020
Capital Managers and Professional Investment Advisors
visit: www.ContraryThinker.com.
— Contrary Thinker does not assume the risk of its clients trading futures and offers no warranties expressed or implied. The opinions expressed here are my own and grounded in sources I believe to be reliable but not guaranteed.
— Pricing is subject to change without notice. My indicators and strategies can be withdrawn for private use without notice, and at any time.


