
- IT40 reversed from support area
- Likely to rise to 22425.00
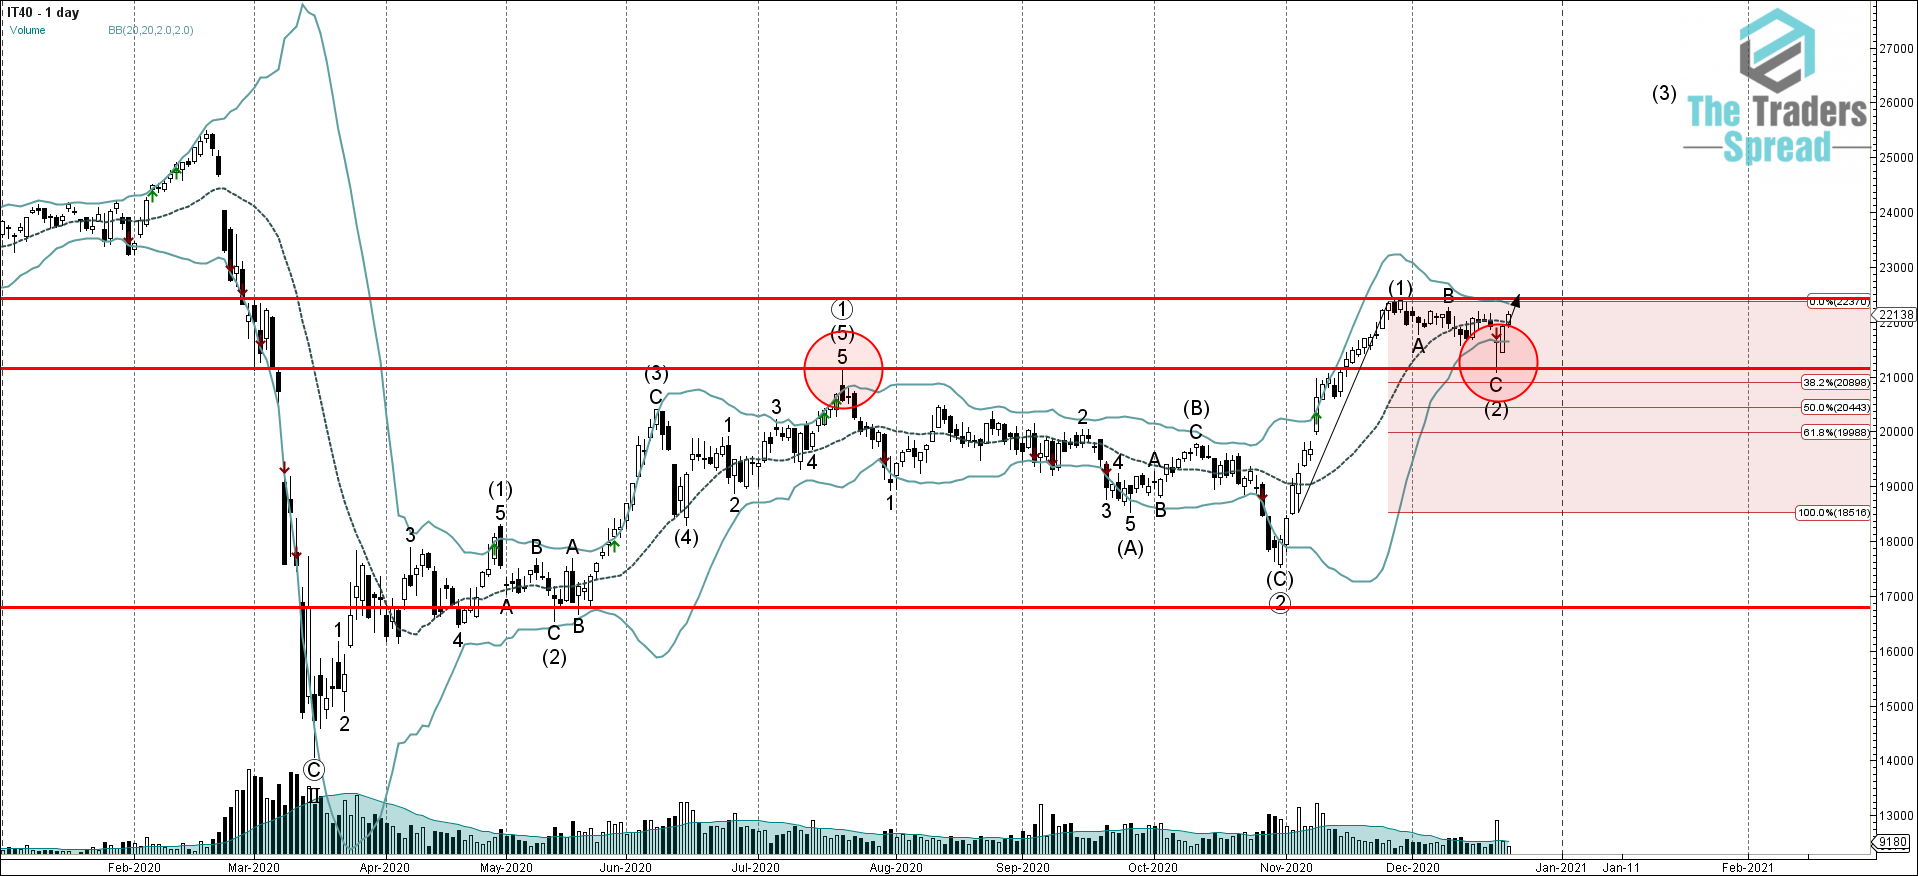
IT40 index continues to rise strongly after the price reversed up with the clearly formed daily Hammer from the powerful support area lying between the key round support level 21150.00 (former multi-month resistance level from July, acting as support after it was broken by the previous impulse wave (1)), lower daily Bollinger Band and the 38.2% Fibonacci correction of the upward price impulse wave (1).
Given the prevailing uptrend and the hopes the new virus strain can still be effectively controlled via mass vaccination in Italy – IT40 index is likely to rise further in the active impulse wave (3) toward the next resistance level 22425.00 (top of the previous impulses wave (1) from the end of November).
Was this post helpful?
Let us know if you liked the post. That’s the only way we can improve.


