
- Gold reversed from support area
- Likely to rise to 1910.00
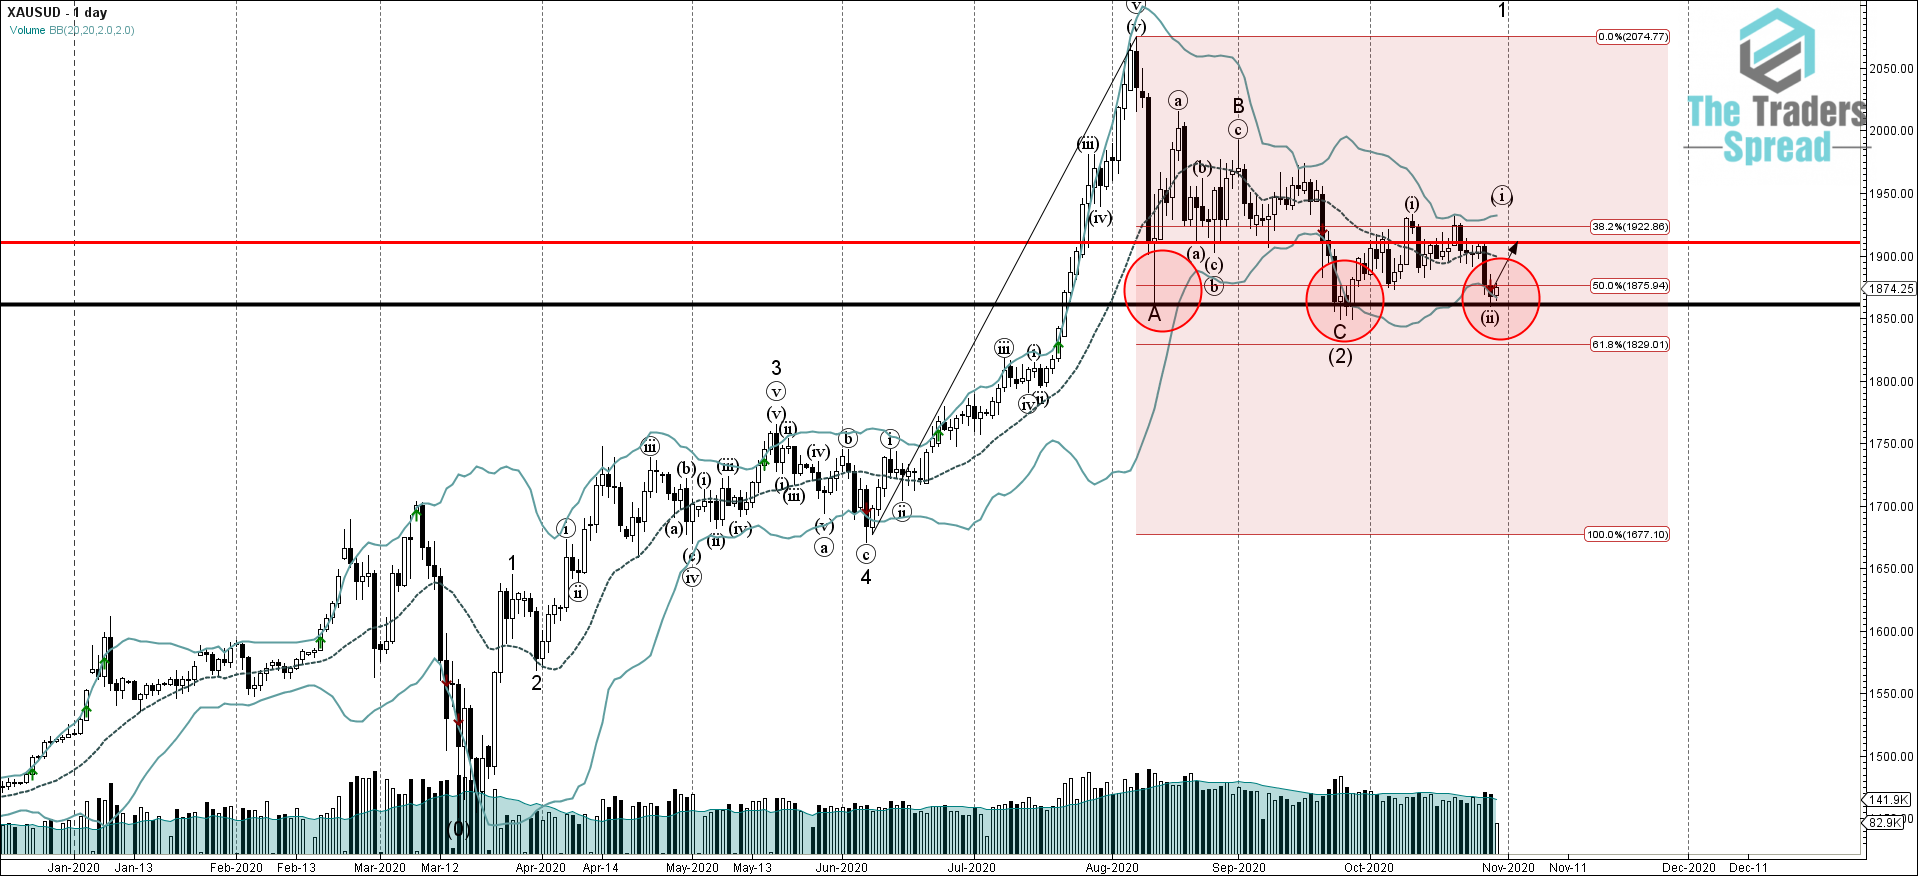
Gold reversing some of the previous losses today after the price yesterday formed the daily Doji candlesticks reversal pattern inside the support area lying between the key support level 1860.00 (which has been repeatedly reversing the price from the start of August, as can be seen from the daily Gold chart below), lower daily Bollinger Band and the 50% Fibonacci retracement of the previous upward price thrust 5 from the start of June.
Considering the long-term uptrend that can be seen on the daily Gold charts – Gold is expected to rise further toward the next resistance level 1910.00 – the breakout of which will lead to the test of the next resistance level 1930.00 (top of the previous minor impulse wave (i)).
Was this post helpful?
Let us know if you liked the post. That’s the only way we can improve.


