- Gold falling strongly
- Likely to fall to 1750.00
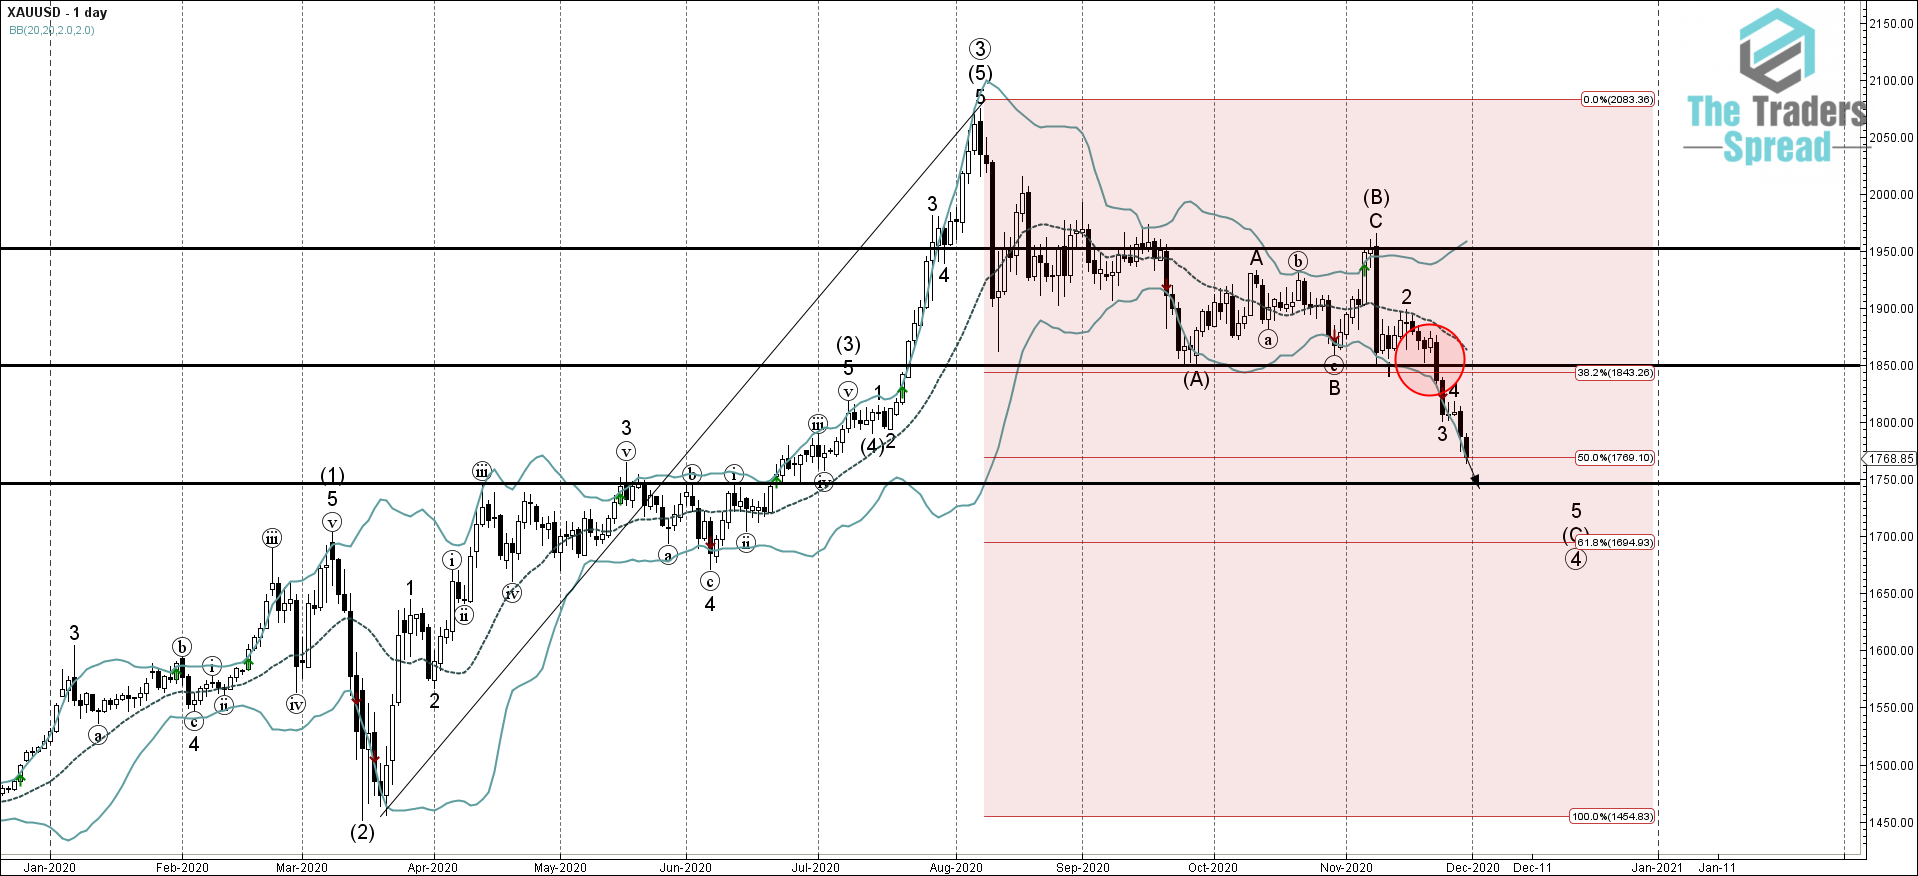
Gold continues to fall strongly after recently breaking through the major support level 1850.00 (which has been repeatedly reversing the yellow metal from the end of September as can be seen from the daily Gold chart below) intersecting with the 38.2% Fibonacci correction level of the previous sharp upward impulse from the middle of March . The breakout of support level 1850.00 strengthened the bearish pressure on Gold – accelerating the active impulse waves 5 and (C).
Given the rising risk-on sentiment seen across the markets today – Gold is likely fall further in the active impulse waves 5 and (C) toward the next support level 1750.00 (former pivotal support from the end of June, former key resistance level which reversed the price multiple times from April to June).