- Gold broke resistance area
- Likely to rise to 1965.00
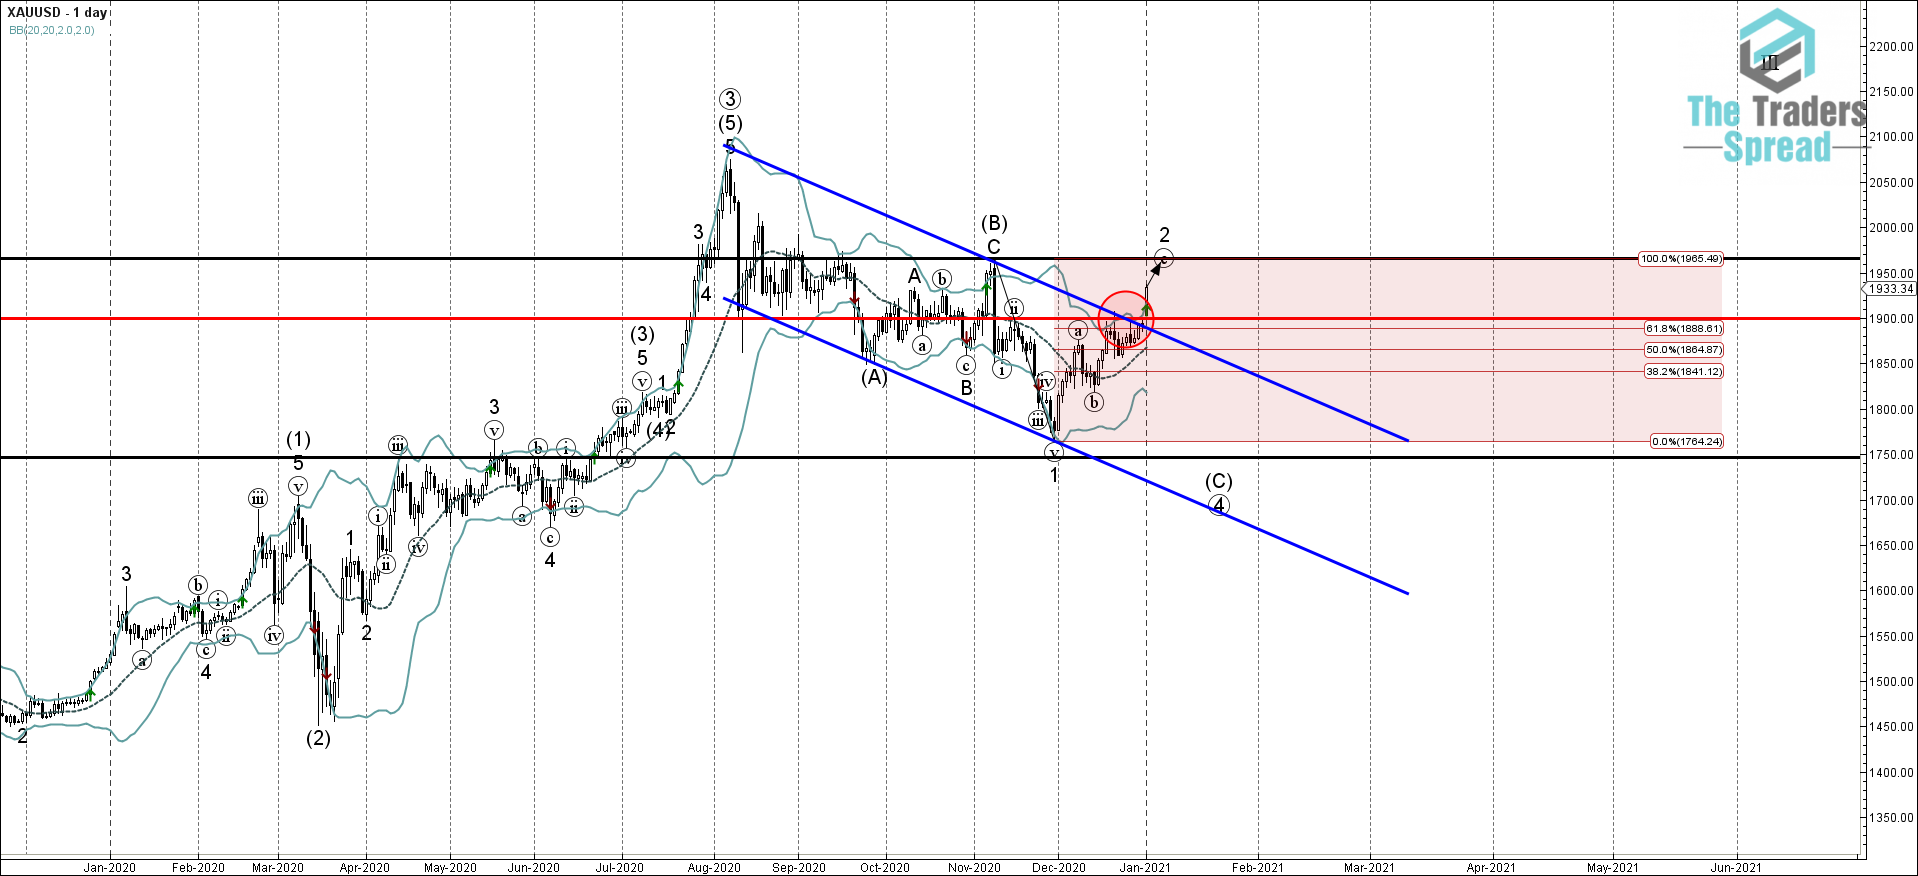
Gold continues to rise strongly after the price broke through the powerful resistance area lying between the round resistance level 1900.00 (which has been repeatedly reversing the price from the start of November as can be seen from the daily Gold chart below, intersecting with the resistance trendline of the daily down channel from August and the 61.8% Fibonacci correction of the previous downward impulse wave 1. The breakout of this resistance area accelerated the active impulse wave (c).
Given the multi-month uptrend and the latest rise in risk-off sentiment on skyrocketing covid-19 cases across Europe and USA – Gold is likely to rise further toward the next pivotal resistance level 1965.00 (monthly high from November and the target for the completion of wave 2).