
• Gold broke resistance area
• Likely to rise resistance level 1785.00
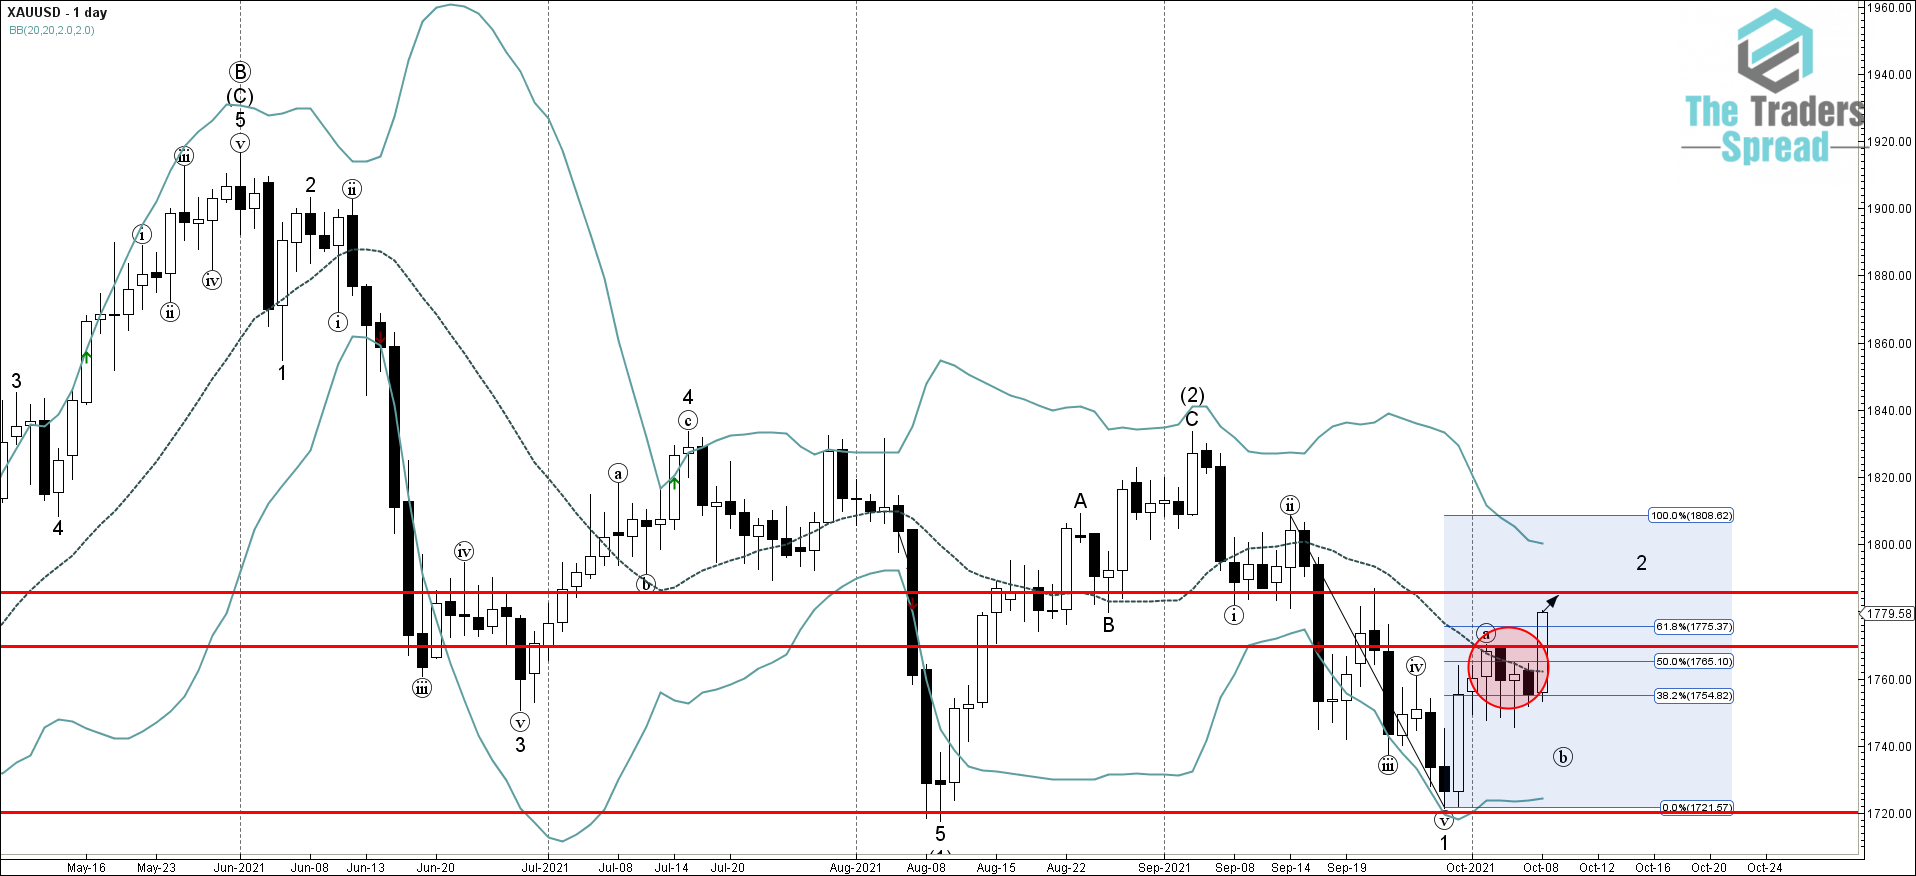
Gold continues to rise after the price broke through the resistance zone set between the resistance level 1769.60 (previous correction (a) high from the start of October, as can be seen from the daily Gold chart below) and the 50% Fibonacci correction of the downward impulse from September. The breakout this resistance area accelerated the active short-term corrective wave 2.
Given the rising demand for gold and other precious metals seen across the commodities markets today, Gold can be expected to rise further toward the next resistance level 1785.00 (target for the completion of the active short-term corrective wave 2).
Was this post helpful?
Let us know if you liked the post. That’s the only way we can improve.


