Today We are looking at gold and the united states dollar and later the 10 Year Treasury Yields.
In the past we have seen an inverse correlation between gold and the united states dollar, when one rises the other falls and vice versa. For the last few months, since the beginning of the pandemic, we have seen gold and the united states dollar trade in similar directions, not perfectly correlated, but an obvious directional similarity exists.
Golds performance in the last several months has pushed it to reach the highs of 2012 at the approximate $1,780 per ounce level. There have been many calls for the value of gold per ounce to climb beyond $2000, and we have tackled this in other editions as to why we don’t see beyond that price, but for today our focus is on what’s driving gold and the USD to travel together.
To us, the answer does not sit with the USD on its own, but the yields of 10-year treasury bonds and their respective yields. Gold has always been somewhat sensitive to the 10-year yield, and over the June period we have seen the yields decline, inherently aiding to the valuation of gold. The last time we saw a spike in the treasury yields we coincidently saw a decline in gold prices, so the relationship is there to observe.
So, what exactly is the relationship then?
If gold has a relationship with treasury yields and the USD, shouldn’t they all be moving together? Not exactly, the noticeable difference to me is the idea of Safe Haven assets, that is the relationship, all 3 have operated as a haven for investors that are not confident in the market.
But usually you would not see all 3 operating as the haven at the same time, the pandemic has changed that relationship. With 10-year yields dropping, the optimum choices have been gold and the USD.
The volatility being experienced now is also contributing to the situation indirectly, we have almost a constant loop of resurging data that is both positive and negative. A tight rope currently exists, between fiscal and monetary stimulus optimism in equities and the honesty of the rest of the economy. This divergence has left the waters pretty muddy, and in the absence of clear waters investors push to the havens, usually not all at the same time but here we are in 2020.
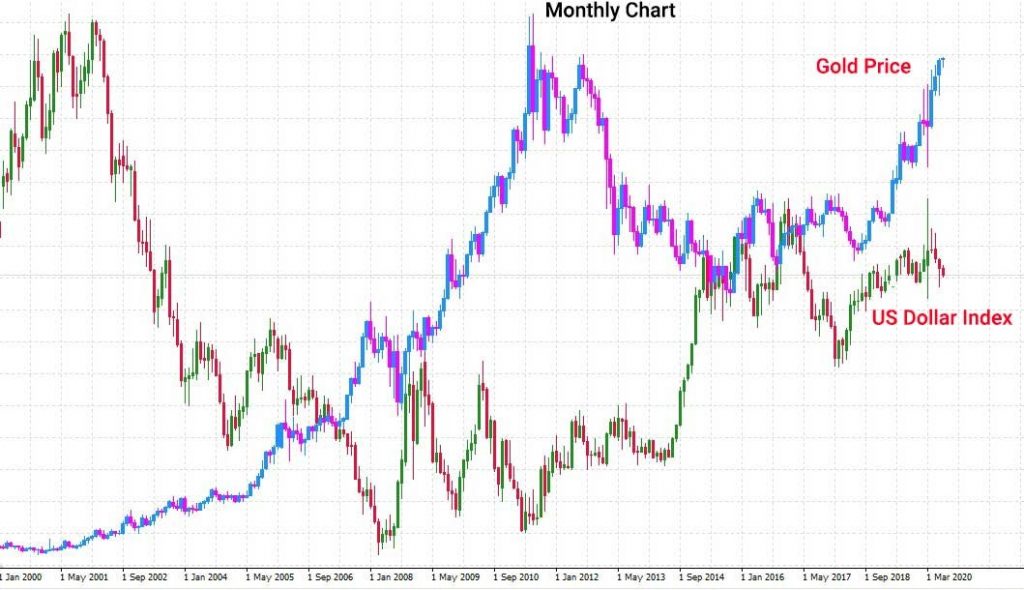
In the chart above We have the USD Index or the DXY represented by the Red and Green Candles as the base with the XAUUSD (Gold vs USD) represented as the blue and pink candles overlayed on top. The chart shows price from approximately the year 2000 until now, the inverse relationship was obvious until it wasn’t at the onset of 2020, when the relationship began correlating as investors piled into safe havens.


