
The quiet in GBP/USD is the loudest thing about it. The pair fixed at 1.3583 on 28 August 2026, up exactly 1.0% over twelve months, and its 20-session realised volatility has collapsed to 3.8% annualised, the lowest reading anywhere in the past year of daily European Central Bank fixes. That stillness is usually read as a market with nothing to say. It is the opposite. Cable is not calm because the risks are small; it is calm because the two central banks that set it have both been frozen for the better part of a year, and a currency pair with no rate differential to trade has nothing to do but drift.
Here is the part the range obscures. Britain now borrows more expensively than America at every maturity beyond five years, despite policy rates that sit 12.5 basis points apart. On 27 August the Bank of England's fitted nominal spot curve put the 30-year gilt at 5.89% while the US Treasury par curve put the 30-year Treasury at 5.19%. That is a 70 basis point premium paid by the sovereign whose policy rate is higher. At two years the gap is the other way round, and small: 4.27% for the gilt against 4.34% for the Treasury. A risk premium that is invisible at the front end and worth 70 basis points at the long end is not a monetary judgement. It is a fiscal one, and it has been building into the 28 October Budget while spot GBP/USD has not moved at all.
Key facts
- GBP/USD fixed at 1.3583 on 28 August 2026, inside a twelve-month range of 1.3044 to 1.3817 — European Central Bank reference rates via frankfurter.dev, 28 August 2026.
- Bank Rate has been 3.75% since 18 December 2025; the MPC held 6–3 on 30 July, with Megan Greene, Catherine L Mann and Huw Pill voting to raise it to 4% — Bank of England, 30 July 2026.
- The federal funds target range has been 3.50%–3.75% all year; the FOMC held 9–3 on 29 July, with Beth M. Hammack, Neel Kashkari and Lorie K. Logan preferring a quarter-point increase — Federal Reserve, 29 July 2026.
- Polymarket prices the September 25 basis point hike leg at 47.5% and no change at 51.5%, on $13.4m and $15.3m of leg volume — Polymarket gamma-api, 30 August 2026, 09:15 UTC.
- UK CPI rose to 2.9% in the year to July 2026 from 2.6% in June, the first increase since March; core CPI was unchanged at 2.6% and services eased to 3.4% — Office for National Statistics, 19 August 2026.
- The 10-year gilt spot yield was 5.11% and the 30-year 5.89% on 27 August, against 4.67% and 5.19% for the equivalent US Treasury par yields — Bank of England nominal spot curve and US Department of the Treasury, 27 August 2026.
- The Budget falls on Wednesday 28 October 2026, the first delivered by John Healey as Chancellor — HM Treasury, 31 July 2026.
Two frozen central banks, and why that pins the pair
An exchange rate between two floating currencies is, at the horizon most traders care about, a trade in the expected path of two policy rates. GBP/USD has almost no path to trade. The Bank of England has held Bank Rate at 3.75% since 18 December 2025, more than eight months without a move. The Federal Reserve has not touched the 3.50%–3.75% target range at any meeting in 2026. The midpoints are 3.75% and 3.625%. Twelve and a half basis points is not a carry trade.
What makes this more than a coincidence is that both committees are split the same way, and in the same direction. The MPC voted 6–3 to maintain Bank Rate at its meeting ending 29 July, with three members preferring 4%. The same day, the FOMC held 9–3, with three participants preferring a quarter-point increase. Two of the world's most-watched committees, each with three voters pushing for tightening, held on the same afternoon. Both are wrestling with the same shock: an energy price surge out of the Middle East that neither can influence and both must look through, or not.
The MPC's own framing is unusually explicit about the bind. "Monetary policy cannot influence energy prices but is being set to ensure that the economic adjustment to them occurs in a way that achieves the 2% inflation target sustainably," the July summary reads, before conceding that "the risks to the inflation outlook are tilted to the upside relative to the central projection". Andrew Bailey, Governor of the Bank of England, put the same judgement more plainly on the day: "Inflation has fallen faster than we'd expected, but the conflict in the Middle East continues to mean high and volatile energy prices. That will cause inflation to rise again later this year."
It already has. UK CPI turned up to 2.9% in July from 2.6% in June, the first increase in the annual rate since March. That is the mechanism holding cable still: the inflation impulse is common to both economies, so it moves both curves together and the differential barely twitches. Traders used to seeing this pair swing on divergence, the structure that drove our USD/JPY forecast, where one central bank is normalising and the other is not, are looking at the exact inverse.
The hawks have names, and the market does not believe them
The three MPC dissenters are not marginal figures, and their reasoning is on the record. Catherine L Mann, external member of the Monetary Policy Committee, wrote that "a variety of research methods concludes that Bank Rate should be higher than 3.75% to return inflation to the 2% target sustainably", and that "reinforcing policy credibility when faced with inflationary shocks implies that a 25 basis point increase in Bank Rate is appropriate at this time". Huw Pill, Chief Economist at the Bank of England, argued for raising Bank Rate "thereby cutting through noise in commodity and asset price developments to offer a clear and unambiguous signal of our willingness and ability to address upside risks to inflation stemming from events in the Gulf". Megan Greene, external member of the MPC, made the risk-management case: "a proactive hike in Bank Rate may reduce the probability that second-round effects set in".
Now put that against what sterling money markets are actually pricing. On 27 August the Bank of England's own SONIA overnight index swap curve had the one-year spot rate at 3.734%, the one-year forward at 3.738% and the three-year forward at 3.871%. SONIA fixes a few basis points below Bank Rate, so those levels are not directly comparable with 3.75%; the slope is what carries the information, and the slope is nearly flat. The curve prices roughly a single quarter-point of tightening spread over three years, from a committee where a third of the votes want that quarter point immediately.
Bailey made the same reading explicit at the July press conference. The market curve, he told reporters, "is consistent with the central view in the market that rates will stay unchanged this year. But there is a distribution of risk which puts it on the upside." Pressed on whether the committee was moving towards tightening, he was blunter: "please do not leave this room thinking that the Bank of England is edging towards a hike, because, frankly, there's nothing in what I said, and I think any of us have said, along those lines."
The dollar leg is the mirror image, and it is far from priced for nothing. The US two-year Treasury yielded 4.34% on 28 August against a funds midpoint of 3.625%, a gap of 71 basis points that embeds both term premium and expected tightening. Either way, it is a front end priced for movement rather than for stillness. On the September FOMC contract on Polymarket, the 25 basis point increase leg trades at 47.5% against 51.5% for no change, on $28.7m of combined volume across the two legs. We covered that repricing in detail in our analysis of the September Fed decision.
The asymmetry is the point. One leg of GBP/USD carries a coin-flip policy event in seventeen days; the other carries a curve that prices one quarter-point spread over three years. That is not a configuration that produces 3.8% realised volatility for long.
What the numbers actually say
The chart below sets twelve months of daily fixes against the year-end scenario levels discussed in the final section.
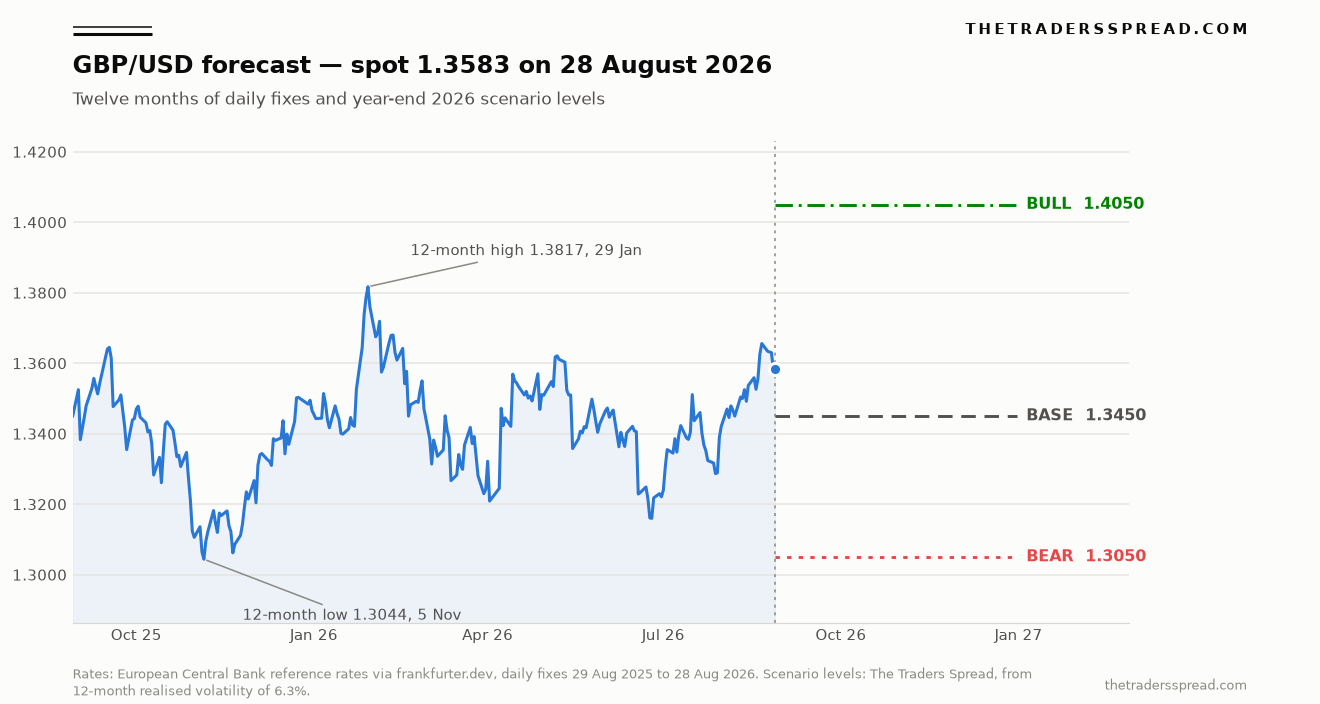
Two things stand out from the series. The first is the sheer narrowness: cable closed inside 1.32–1.38 on 232 of the past 255 ECB fixes, and has not closed outside that band since 25 June. The second is that the trend is mildly higher and entirely unimpressive — 1.3449 a year ago, 1.3583 now, with the 200-day mean at 1.3428 sitting almost exactly in the middle.
The interesting divergence is not in spot at all. It is in the curves, and the synthesis of the two official sources tells a story neither tells alone.
| Maturity | UK (BoE nominal spot, 27 Aug) | US (Treasury par, 27 Aug) | UK minus US |
|---|---|---|---|
| Policy rate (midpoint) | 3.75% | 3.625% | +12.5 bp |
| 2-year | 4.27% | 4.20% | +7 bp |
| 5-year | 4.55% | 4.38% | +17 bp |
| 10-year | 5.11% | 4.67% | +44 bp |
| 30-year | 5.89% | 5.19% | +70 bp |
The two curves are built on different conventions. The Bank of England publishes a fitted zero-coupon spot curve and the Treasury a par yield curve, so the levels are not perfectly like for like. The shape of the difference is what matters, and it is unambiguous. The premium Britain pays is negligible where monetary policy dominates and widest where fiscal credibility does. UK 2s30s steepened to 162 basis points against 99 basis points for the equivalent US spread.
That premium is also moving. Across August the 10-year gilt spot yield rose from 4.96% on 5 August to a peak of 5.15% on 18 August before settling at 5.11%, and the 30-year traced the same path from 5.78% to 5.97% and back to 5.89%. Fifteen basis points of net repricing at ten years and eleven at thirty, inside a month with no policy meeting in it. Sterling spot did the opposite: it rose from 1.3479 on 5 August to 1.3583, a gain of 0.8%. Bond investors demanded more to hold long gilts in August. The currency market charged nothing.
The Budget is the event nothing has priced
The UK has a new Prime Minister and a new Chancellor. John Healey took the Treasury on 20 July 2026, succeeding Rachel Reeves, in a cabinet formed by Prime Minister Andy Burnham. Eleven days later he confirmed his first Budget for Wednesday 28 October, describing it as "a Budget that moves money and power out of Westminster, and into every postcode around Britain" that "will be built on fiscal discipline" and "will meet our fiscal rules".
In his first speech to Treasury staff he put that commitment first among five priorities, while describing the position he inherited as "low growth, high debt, too much inequality, overstretched public finances". He has already cut tax from electricity bills, a measure that lowers measured CPI and costs money at the same time.
None of this is a prediction of disorder. The gilt market has repriced steadily, not violently, and the Bank still holds £491 billion of gilts for monetary policy purposes as at 17 July. But it is a scheduled, dated event in a pair whose realised volatility assumes nothing happens. The 2022 precedent is not a forecast; it is a reminder that the gilt market prices a new Chancellor's first Budget before the currency market does, and that when sterling reacts it tends to do so in one move rather than ten.
The macro backdrop gives the MPC room to sit still while it waits. UK GDP grew 0.4% in the second quarter after 0.6% in the first, up 1.2% on the year. The unemployment rate was 4.9% in April to June, up 0.2 percentage points on the year, with payrolled employees down 94,000 over twelve months on the July estimate and vacancies at 707,000. Private-sector regular pay growth has slowed to 2.8%, a rate consistent with the target. That combination of a soft labour market, target-consistent private wages and an imported energy shock is exactly why six MPC members voted to wait. It is also why the pound has no domestic story to rally on.
The call: base 1.3450, bull 1.4050, bear 1.3050
Our horizon is 31 December 2026. Twelve-month realised volatility of 6.3% implies a one standard deviation range of roughly 1.3082 to 1.4084 by year-end, which is the band the scenarios sit inside.
Base case, 1.3450 (48% probability). The range holds. Neither central bank moves decisively, the Budget passes without a gilt accident, and cable mean-reverts to its 200-day average of 1.3428. This is 1.0% below spot, and it is the outcome the option and swap markets are currently paid to expect.
RelatedUSD/MXN Forecast: 17.70 Bull Case vs 16.25 Bear Case
Bear case, 1.3050 (28% probability). A retest of the 5 November 2025 low of 1.3044, 3.9% below spot. The path runs through a Fed hike on 16 September that the BoE does not match on 17 September, widening a differential that is currently negligible, followed by a Budget on 28 October that the long end of the gilt curve reads as loosening rather than discipline. Sterling's fiscal premium is already visible at 30 years; the bear case is simply that it migrates into the exchange rate.
Bull case, 1.4050 (24% probability). A clean break above the 29 January high of 1.3817, 3.4% above spot. The path is a dollar unwind: the Fed holds on 16 September, the 71 basis points of tightening priced into the US two-year deflates, and a hot UK August CPI print on 16 September converts the MPC's three hawks into a majority. Sterling would then be the currency with a live hike and the dollar the one giving back a premium.
What would change my mind. Two triggers, both dated. If UK CPI for August prints at 3.2% or higher on 16 September and the MPC vote on 17 September narrows to 5–4 or delivers a hike, the downside skew is wrong and 1.3817 becomes a target rather than a ceiling. Separately, if the 30-year gilt premium over the 30-year Treasury narrows below 50 basis points before 28 October, the fiscal risk the bear case rests on is unwinding on its own and the 1.3050 level should be abandoned. Either condition invalidates the skew, not merely the level.
For the sibling views on the dollar's other crosses, see our USD/MXN forecast and AUD/USD forecast, both of which sit on the same hawkish-Fed assumption from the opposite side.
Frequently asked questions
What is the GBP/USD rate right now?
GBP/USD fixed at 1.3583 on 28 August 2026, using European Central Bank reference rates retrieved via frankfurter.dev. That is 1.0% higher than the 1.3449 fix of 29 August 2025 and sits between the twelve-month low of 1.3044 on 5 November 2025 and the twelve-month high of 1.3817 on 29 January 2026.
Why is GBP/USD so quiet in 2026?
Because neither central bank has moved. Bank Rate has been 3.75% since 18 December 2025 and the federal funds target range has been 3.50%–3.75% throughout 2026. With the policy midpoints 12.5 basis points apart and both committees holding through the same energy shock, there is no rate differential for the pair to trade, and 20-session realised volatility has fallen to 3.8%.
What could move GBP/USD in September 2026?
Three dated events inside thirty hours. UK CPI for August is published on 16 September, the FOMC decides on 15–16 September, and the MPC decision follows on 17 September. UK labour market data lands on 15 September. A Fed hike unmatched by the Bank of England, or a UK inflation surprise that flips the MPC, would break the range in opposite directions.
How does the October Budget affect the pound?
The Budget on 28 October is John Healey's first as Chancellor and the first fiscal event of a new government. Gilt markets have already built a premium: the 30-year gilt yielded 5.89% on 27 August against 5.19% for the 30-year Treasury, a 70 basis point gap despite a higher UK policy rate. Sterling has not repriced that premium.
Is the Bank of England more likely to raise or cut next?
Raise, on the current voting record, though the market disagrees on timing. Three of nine MPC members — Megan Greene, Catherine L Mann and Huw Pill — voted for 4% on 30 July. The SONIA overnight index swap curve nonetheless prices only a gentle drift, with the one-year forward at 3.738% rising to 3.871% at three years, and Andrew Bailey told reporters on 30 July not to leave the room "thinking that the Bank of England is edging towards a hike".
What is the GBP/USD forecast for the end of 2026?
Our base case is 1.3450 with 48% weight, close to the 200-day average of 1.3428. The bear case is 1.3050 at 28%, a retest of the November 2025 low. The bull case is 1.4050 at 24%, a break of the January high. All three sit inside the one standard deviation band implied by 6.3% twelve-month realised volatility.
Disclaimer
This article is analysis and information only. It is not investment advice, a recommendation, or an offer to transact in any instrument, and it does not take account of any individual's circumstances. Foreign exchange and contracts for difference are leveraged products; capital is at risk and losses can exceed deposits. Prices and yields cited were correct at the times and dates stated and will have changed since. Always do your own research. Further market coverage is collected on our markets hub.