

Almost every AUD/USD forecast still in circulation describes a dovish Federal Reserve meeting a Reserve Bank of Australia on a "hawkish pause". That framing is a year out of date, and the pair has already voted against it. AUD/USD trades at 0.7190 on 27 August 2026, less than 1% below its 52-week high of 0.72569 and 11.6% above the 0.64455 low set last November. The reason is not a weak dollar. It is that the Reserve Bank of Australia has raised the cash rate three times this year — from 3.60% to 4.35% — and told the market on 11 August that it is prepared to go further. Our year-end scenarios are 0.7450 bull, 0.7200 base and 0.6950 bear, and the distribution around them is far more symmetric than the consensus commentary implies.
Here is what almost nobody has re-priced. The carry argument on this pair has not merely survived — it has inverted. Through 2025 the RBA cut three times, to 3.60%, and the Australian dollar was a funding currency. Since February 2026 it has hiked at three consecutive meetings while explicitly retaining a tightening bias. Against that, prediction markets currently assign an 87.9% probability that the Federal Reserve delivers zero rate cuts in 2026, on roughly $7.6 million of volume in that single contract. Set those two facts side by side and the rate differential is moving in the Australian dollar's favour on both legs at once — Australia tightening, the United States not easing. A pair sitting 0.9% off its 52-week high is not defying its fundamentals. It is the only participant that has actually updated for them.
Key Facts: AUD/USD at a Glance
- AUD/USD 0.7190 on 27 August 2026, against a 52-week range of 0.64455–0.72569 — European Central Bank daily reference rates via frankfurter.dev
- RBA cash rate 4.35%, held unanimously on 11 August 2026 — RBA Monetary Policy Board statement
- Three +25bp increases in 2026: 4 February to 3.85%, 18 March to 4.10%, 6 May to 4.35% — RBA cash rate target series
- 87.9% implied probability of zero Fed cuts in 2026, from a market with about $49.9 million of total volume — Polymarket, 27 August 2026
- 90-day realised volatility 6.6% annualised, against 5.7% over 30 days and 7.9% over one year — The Traders Spread calculation on ECB daily fixes
- RBA does not expect inflation back near the midpoint of target until late 2027 — RBA, 11 August 2026
- Technical support at 0.7069 and 0.6999, the 100-day and 50-day simple moving averages — Christian Borjon Valencia, FXStreet, 21 August 2026
What the Reserve Bank Actually Said
The 11 August statement is worth reading rather than summarising, because the summaries have been misleading. The Board left the cash rate at 4.35% and described monetary policy as "somewhat restrictive" — but the operative sentence is forward-looking: the Board "will continue to do what it considers necessary to bring inflation sustainably back to target, including increasing the cash rate target further if upside risks materialise." That is not a pause with an easing bias attached. It is a hold with a hiking bias attached, and the decision was unanimous.
The economic assessment behind it is equally hawkish. Inflation "picked up materially in the second half of 2025", headline inflation is "still too high", and trimmed mean inflation "remains elevated and is little changed from the March quarter". Critically, the Bank does not expect inflation to return to around the midpoint of its target band until late 2027, and it flags "upside risks to this projection". A central bank with an eighteen-month runway back to target and upside risks on top of it is not a central bank about to cut.
The currency gets an explicit mention. Listing the effects of this year's tightening, the Board notes that "money market interest rates and government bond yields have risen, and the exchange rate has appreciated." The RBA is not fighting the Australian dollar's strength; it is counting it as part of the transmission mechanism doing its job.
The complicating variable is oil. The statement repeatedly cites the Middle East conflict, noting that "global oil supply will take time to recover, maintaining upward pressure on global energy prices and inflation". For most currencies that is a straightforward negative. For the Australian dollar it is not, and this is the part of the story that generic FX commentary consistently gets backwards.
Why an Energy Shock Helps This Particular Currency
Australia is a net energy exporter. It is among the world's largest exporters of liquefied natural gas and metallurgical and thermal coal, alongside iron ore. When a supply disruption pushes global energy prices higher, Australia's terms of trade — the ratio of export prices to import prices — improve. Higher export receipts mean more foreign currency converted into Australian dollars, which is a mechanical bid for the currency that operates entirely separately from interest-rate differentials.
This produces an unusual and under-appreciated alignment. The same oil-supply disruption that is keeping Australian inflation elevated — and therefore keeping the RBA hawkish — is also improving Australia's terms of trade. One shock is pushing both the interest-rate channel and the trade channel in the same direction, and both point toward a firmer Australian dollar. Contrast that with the euro or the yen, where an energy shock worsens the trade balance and forces the central bank to choose between inflation and growth. Australia does not face that trade-off in the same form.
The offsetting risk is China, and it is real. Australia's export complex is levered to Chinese construction and steel production, so iron ore volumes and prices remain the single largest external variable for the currency. A renewed contraction in Chinese manufacturing would hit Australia's terms of trade from the other side and would do so faster than any interest-rate differential could compensate for. The RBA itself notes that growth among Australia's major trading partners has so far been "stronger than expected, as the boost from AI-related investment has outweighed the adverse effects of the Middle East conflict" — an acknowledgement that the current strength depends on an AI capital-expenditure cycle that is itself concentrated in a handful of balance sheets, as this week's Nvidia results underlined.
The Distribution, Not the Direction
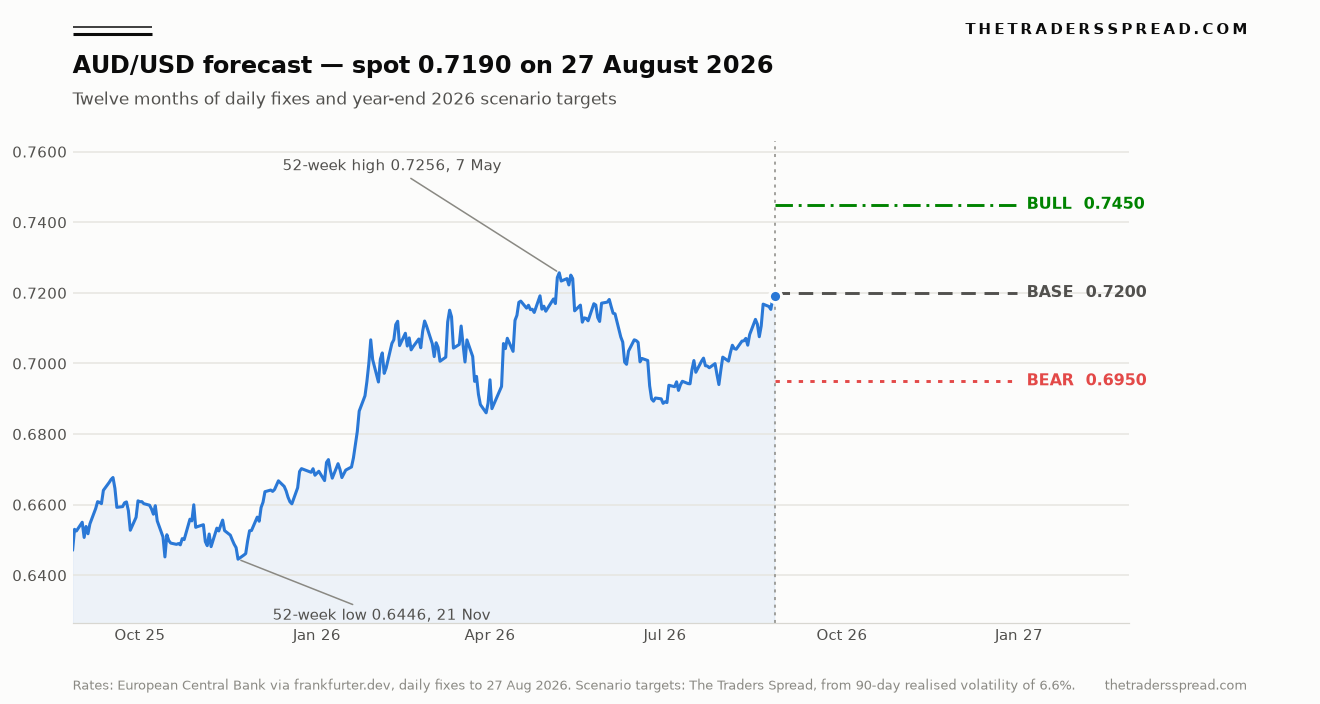
AUD/USD is a low-volatility instrument and that fact should discipline every target attached to it. Realised volatility is 6.6% annualised over 90 days — roughly a tenth of what a major cryptocurrency prints, and low even by G10 standards. Applying that volatility to the 126 days remaining in the year produces the following probabilities of the pair touching each level before 31 December 2026.
| Level | Probability of touching by 31 Dec 2026 | Interpretation |
|---|---|---|
| 0.7550 | 20.2% | Requires a genuine breakout |
| 0.7450 — bull case | 35.3% | Clears the 52-week high decisively |
| 0.7250 | 82.7% | Marginal new high; near-certain |
| 0.7200 — base case | — | Roughly flat from spot |
| 0.7000 | 49.6% | A coin flip |
| 0.6950 — bear case | 38.8% | Breaks the July consolidation |
The striking feature of that table is its symmetry: a 35.3% chance of touching the bull case against a 38.8% chance of touching the bear case. Despite a policy backdrop that reads unambiguously positive for the Australian dollar, the volatility-implied distribution is very close to two-sided. That is the honest read, and it is what separates a forecast from a cheerleading exercise. The directional case is strong; the distribution around it is not.
There is a second point buried in the table that matters more for position sizing than for direction. A touch of 0.7250 — a fresh 52-week high — carries an 82.7% probability. Making a new high on this pair between now and December is close to a formality. Holding above it is the difficult part, and the gap between 82.7% at 0.7250 and 35.3% at 0.7450 is the market telling you exactly how much resistance sits in that 200-pip band.
On the technicals, FXStreet's Christian Borjon Valencia identified the 100-day simple moving average at 0.7069 and the 50-day at 0.6999 as the levels beneath the market on 21 August. Those sit above our 0.6950 bear case, which means the bear scenario requires both moving averages to break rather than merely one — a useful structural check on how much has to go wrong for it to trigger.
The Policy Risk Nobody Is Hedging
The regulatory and policy tension on this pair is not about Australia. It is about whether the Federal Reserve's 2026 inaction survives contact with the same oil shock the RBA is responding to.
Prediction markets are pricing an 87.9% probability of zero Fed cuts across 2026, with the one-cut outcome at 8.5% and everything beyond that in low single digits. That is an unusually confident market. It is also a market that has been repeatedly wrong about the Fed in both directions over the past three years, and traders can see the current pricing and depth for themselves on Polymarket's rate-cut market. The asymmetry matters: if that 87.9% is correct, it is already in the AUD/USD price. If it is wrong in the dovish direction, the pair has room above 0.7450 that our volatility model does not contemplate. If it is wrong in the hawkish direction — a Fed forced to hike by energy-driven inflation — the bear case activates quickly.
For Australian and international traders accessing this pair through contracts for difference, the practical constraints are set by regulators rather than by the market. The Australian Securities and Investments Commission caps retail leverage on major currency pairs at 30:1 and has done so since its product intervention order took effect, with equivalent caps applied by the Financial Conduct Authority in the United Kingdom and by ESMA-aligned regimes across the European Union. On a pair with 6.6% realised volatility, the binding constraint on a retail position is almost never the leverage cap — it is the overnight financing cost of holding a low-volatility carry position long enough for the thesis to play out. Those costs vary widely between venues; our broker comparison and the IC Markets review set out where the differences sit on major FX pairs.
The Call: 0.7450 Bull, 0.7200 Base, 0.6950 Bear
Base case — 0.7200 (roughly flat). The RBA holds at 4.35% through year-end, the Fed does nothing, and the pair grinds sideways in the 0.7100–0.7250 band it has occupied since mid-August. This is the highest-probability single outcome precisely because both central banks are on hold: with no policy catalyst, a 6.6%-volatility pair does very little. Flat is not a failure of imagination here; it is what low volatility plus policy stasis produces.
Bull case — 0.7450 (+3.6%), 35.3% probability of being touched. The causal chain: energy prices stay elevated, Australia's terms of trade improve further, the RBA's late-2027 inflation projection forces at least one more hike into the market's pricing, and the Fed's 87.9% no-cut consensus holds. Under that combination the pair clears 0.7256 and the next resistance is thin — the 2022 highs are the reference. This does not require a weak dollar, only a Fed that stays where the market already expects it to stay.
RelatedGBP/USD Forecast: 1.4050 Bull Case vs 1.3050 Bear Case
Bear case — 0.6950 (−3.3%), 38.8% probability of being touched. The path runs through China rather than through Australia. A contraction in Chinese manufacturing hits iron ore volumes and prices, Australia's terms of trade deteriorate, and the AI-related investment boom the RBA credits for trading-partner growth slows. Both the 100-day and 50-day moving averages break, and the July consolidation near 0.6880 comes back into play. Note that this scenario does not require the RBA to turn dovish — it only requires the export channel to fail.
What would change this reading. A single soft Australian CPI print would do more damage to the bull case than anything the Fed does, because it would undermine the hiking bias that is holding the differential open. In the other direction, a Fed forced into a hike by energy-driven inflation would compress the differential from the US side and invalidate the carry argument entirely. The level to watch is not a price but a date: the next RBA decision, where the language around "increasing the cash rate target further" either hardens or softens.
Frequently Asked Questions
What is the AUD/USD forecast for the end of 2026?
Our scenarios are 0.7450 bull, 0.7200 base and 0.6950 bear. On 90-day realised volatility of 6.6%, the bull case carries a 35.3% probability of being touched before 31 December 2026 and the bear case 38.8%. The base case of roughly 0.7200 reflects both central banks remaining on hold.
Why is the Australian dollar rising in 2026?
Interest rate differentials have moved in its favour. The RBA raised the cash rate three times in 2026, from 3.60% to 4.35%, while prediction markets price an 87.9% chance the Federal Reserve delivers no cuts at all this year. Higher global energy prices also improve Australia's terms of trade, since the country is a net energy exporter.
What is the RBA cash rate now?
4.35%, held unanimously at the meeting on 11 August 2026. The Board reached that level through three consecutive 25 basis point increases on 4 February, 18 March and 6 May 2026, and has stated it is prepared to increase the cash rate target further if upside risks to inflation materialise.
Will AUD/USD reach 0.75?
It is possible but not the central case. A touch of 0.7550 carries roughly a 20.2% probability before year-end on current volatility, against 35.3% for 0.7450. Reaching the mid-0.75s would likely require the Federal Reserve to begin easing, which the market currently assigns only a 12.1% combined probability across all cut outcomes for 2026.
What is the biggest risk to the Australian dollar?
China. Australia's export complex is levered to Chinese construction and steel demand, so a contraction in Chinese manufacturing would damage the terms of trade faster than any interest rate differential could offset. That channel, rather than domestic monetary policy, is what drives the bear case toward 0.6950.
How volatile is AUD/USD compared with other assets?
Modestly. Realised volatility is 6.6% annualised over 90 days and 7.9% over one year, low even among G10 currency pairs and roughly a tenth of a major cryptocurrency's. That low volatility is why the realistic scenario band is only about 3.5% either side of spot, and why leverage rather than direction usually determines retail outcomes on this pair.
Analysis and information only; not investment advice. Contracts for difference are leveraged products carrying a high risk of rapid loss. Rates cited are European Central Bank daily reference rates as at 27 August 2026. Links to Polymarket are affiliate links. Featured image: Reserve Bank of Australia, Knowles Place view, by Shkuru Afshar, CC BY-SA 4.0 via Wikimedia Commons.
