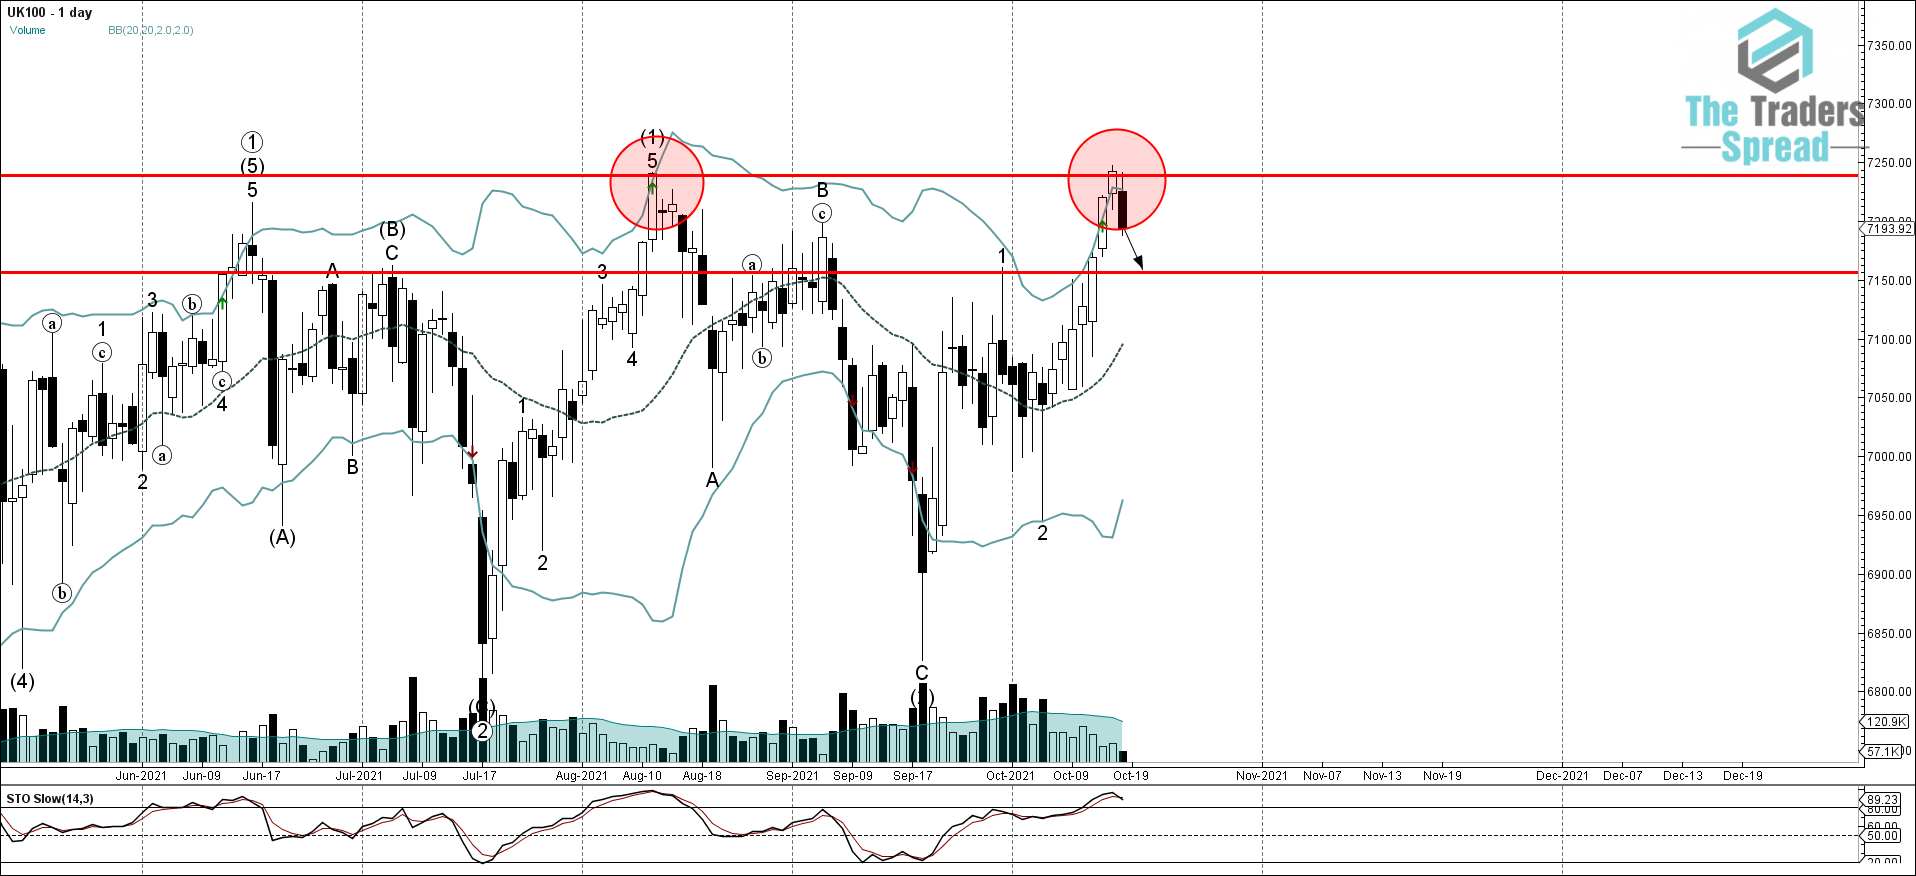
• FTSE 100 reversed from resistance zone
• Likely to fall to support level 7150,00
FTSE 100 index under the bearish pressure after the index reversed down from the resistance zone lying between the long-term resistance level 13240,00 (previous multi-month high from August, as can be seen from the daily FTSE 100 chart below) and the upper daily Bollinger Band .The downward reversal from this resistance zone stopped the previous sharp upward impulse wave 3.
Given the strength of the aforementioned support zone and the overbought reading on the daily Stochastic indicator , FTSE 100 index can be expected to fall further toward the next support level 7150,00 (former resistance from the end of September).
Was this post helpful?
Let us know if you liked the post. That’s the only way we can improve.