• FTSE 100 index reversed from support area
• Likely to rise to resistance level 7333.00
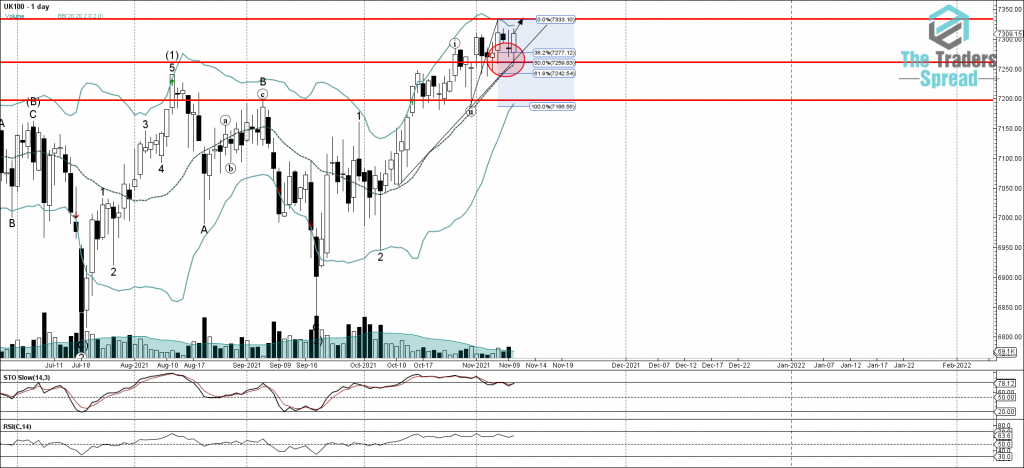
FTSE 100 index recently reversed up from the support area located between the key support level 7260.00 (which has been reversing the price from the start of November), 20-day moving average, support trendline from the start of November and the 38.2% Fibonacci correction of the upward price impulse from the end of October, as can be seen from the daily FTSE 100 chart below. The upward reversal from this support area continues the active short-term impulse wave (iii) from last month.
Given the clear multi-month uptrend, FTSE 100 index can be expected to rise further toward the next resistance level 7333.00 (which stopped the index at the start of this month).


