
EURUSD, “Euro vs US Dollar”
EURUSD is no longer consolidating within a Triangle pattern; after reaching 1.1890, it has broken this level to the upside. At the moment, the pair is trying to break the mid-term resistance line and start a new ascending structure. However, before starting this wave, the asset must test the line from above and rebound towards 1.1960. The support area is at 1.1852. one should note that the MACD indicator is forming a divergence, which may hint at a possible reversal after the instrument reaches 1.1960.

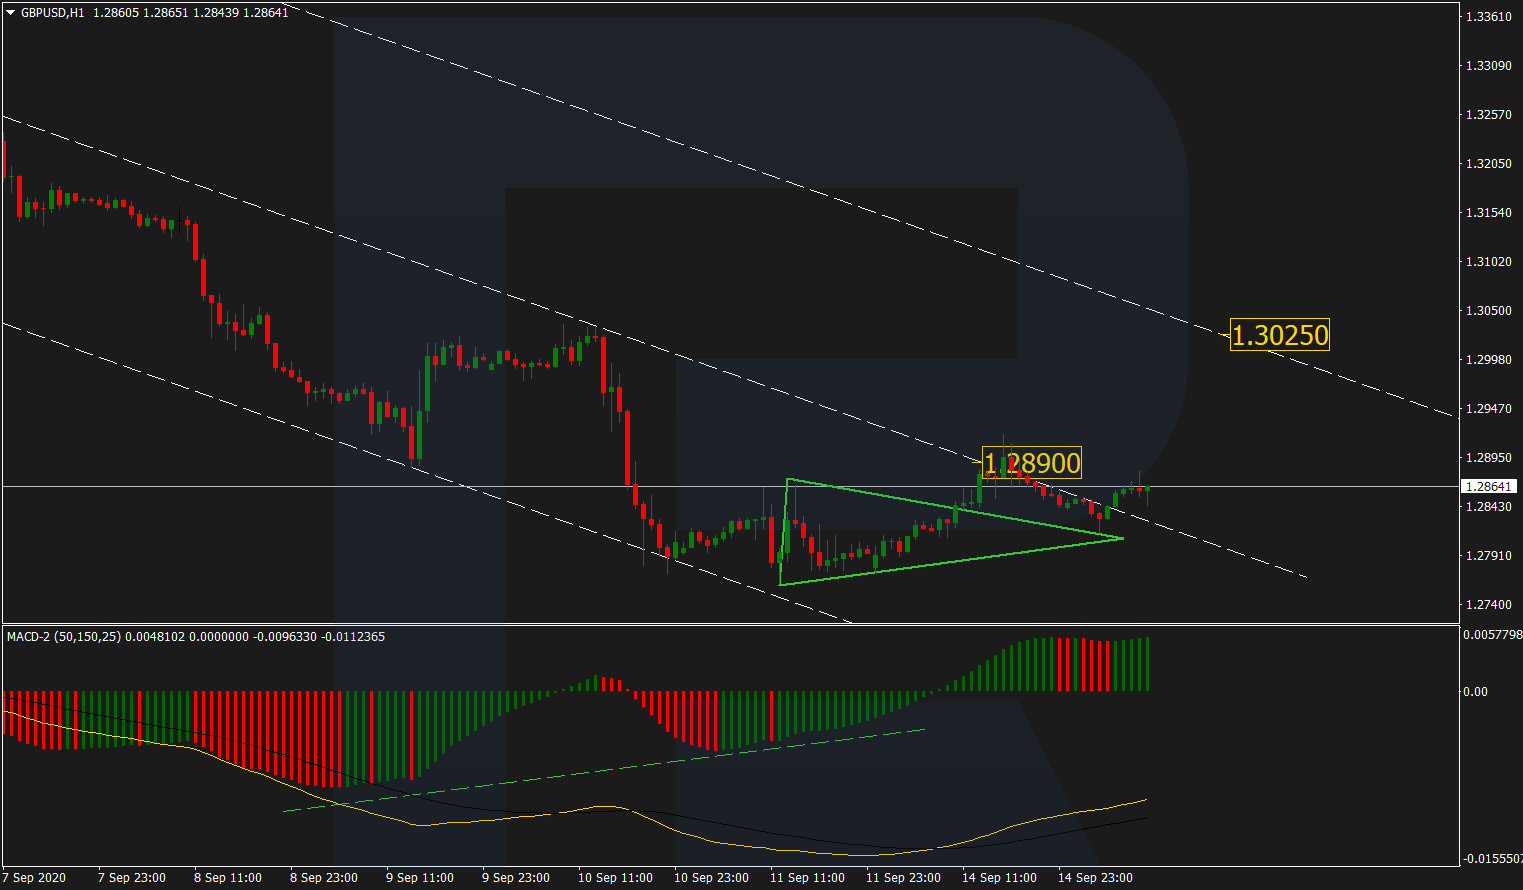
GBPUSD, “Great Britain Pound vs US Dollar”
After breaking the upside border of a short-term Triangle pattern and testing the resistance line of the mid-term channel at 1.2890, GBPUSD has completed another pullback and broken the resistance line; right now, it is expected to form a new ascending impulse towards 1.3025. If later the price breaks this level, the market may resume the mid-term uptrend.
USDJPY, “US Dollar vs Japanese Yen”
After rebounding from the descending channel’s upside border, USDJPY has reached 105.60ж right now, it is testing the support line. After that, the instrument is expected to fall towards 104.93. However, there might be an alternative scenario that implies a possible rebound from the support line and further growth to reach the key resistance line at 106.10.

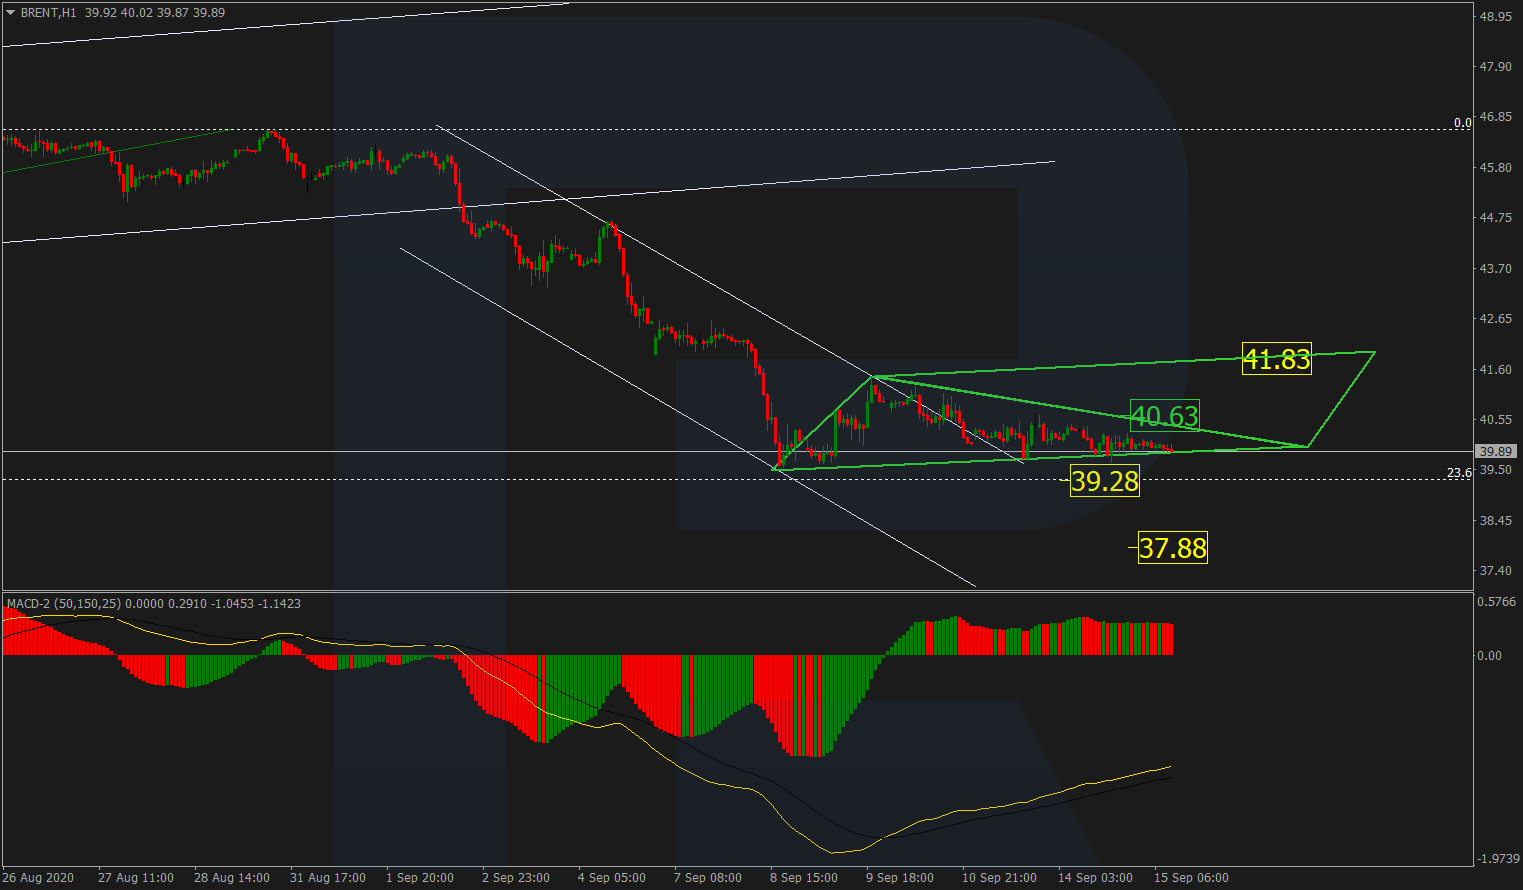
BRENT
Brent is still correcting within a Triangle pattern and testing its downside border. If the pair breaks the support line at 39.70, the market may fall to break 23.6% fibo (39.28) and then reach 37.88. However, judging by the MACD indicator, which is directed to the upside, the price may break the resistance line at 40.63 and then expand the correctional channel up to 41.83.
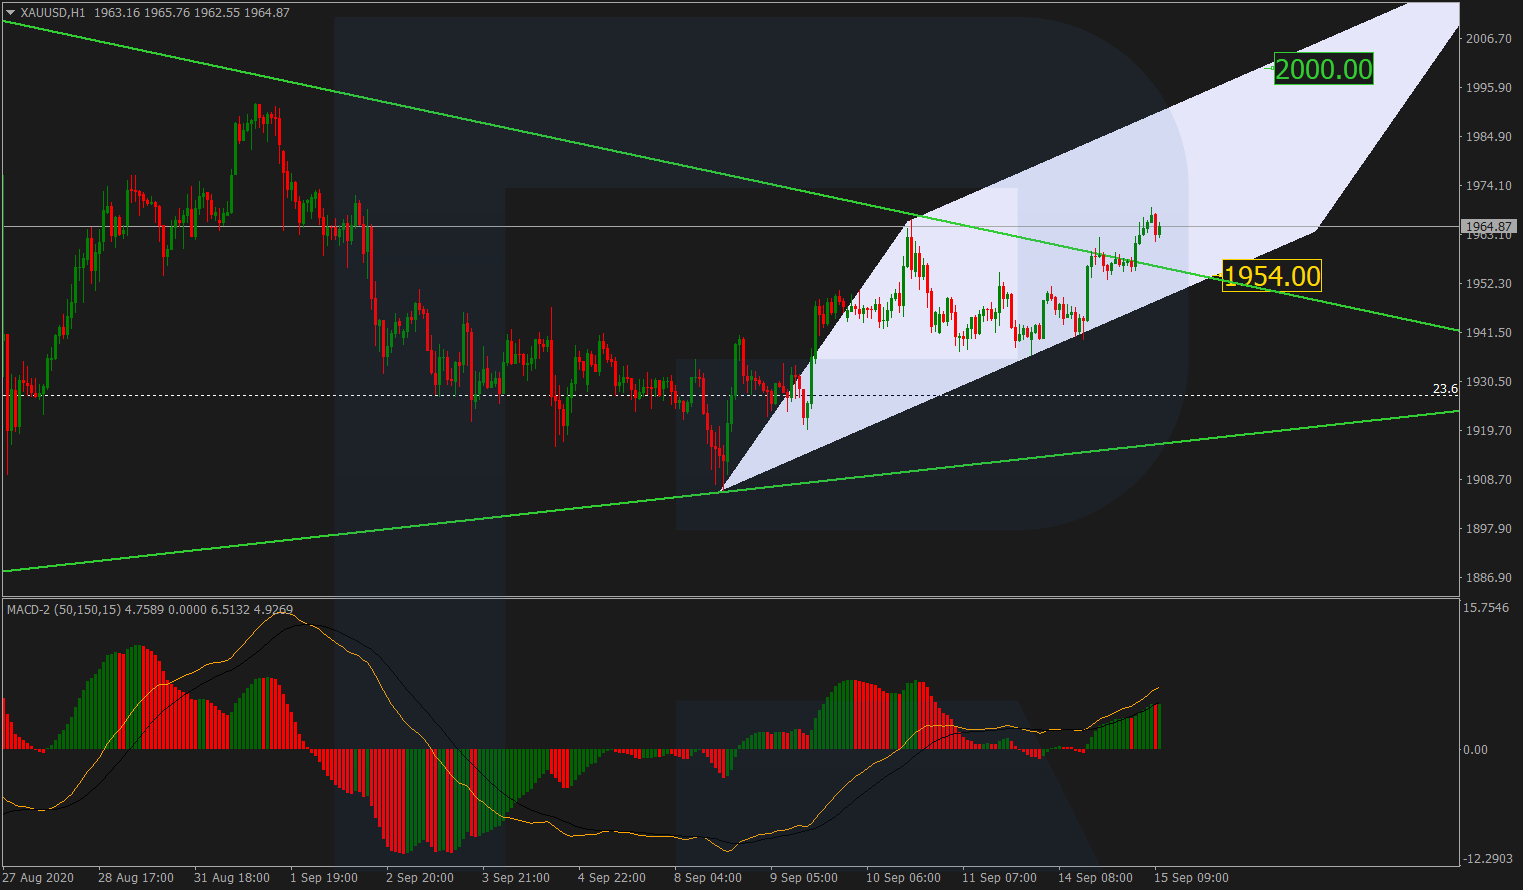
XAUUSD, “Gold vs US Dollar”
After finishing a short-term sideways channel and testing the resistance line of a mid-term Triangle pattern at 1960.00, Gold has broken the line and may form a new pullback to test it from above soon. The target of this pullback is at 1954.00. Later, the market may rebound from this level and start a new growth with the target at 2000.00.
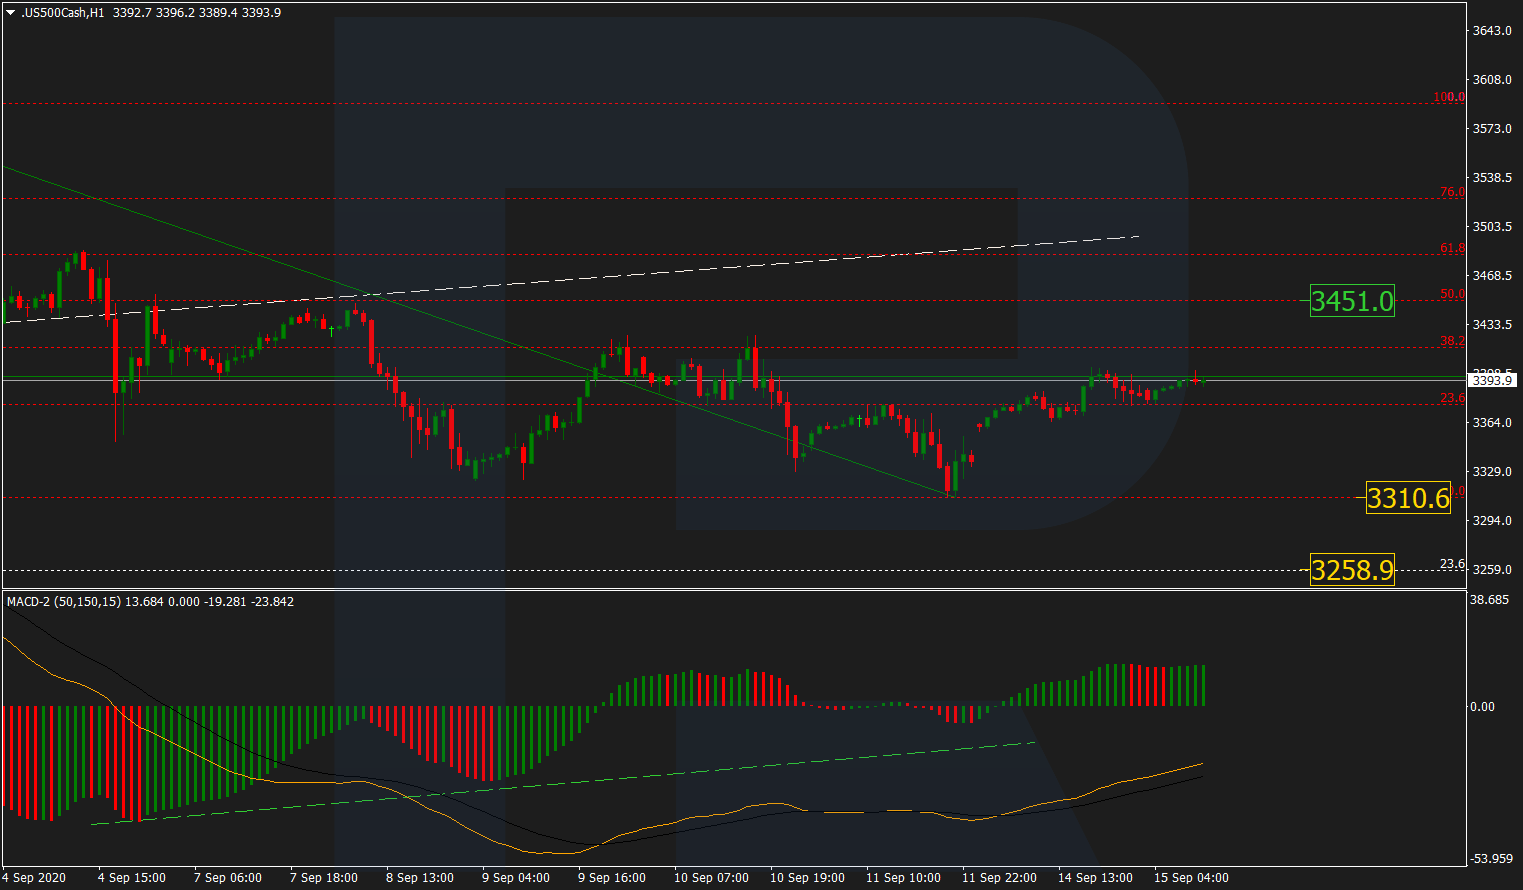
S&P 500
After breaking the long-term support line, the S&P 500 index has started a mid-term correction or even a reversal. As we can see, the convergence on MACD made the asset start a new correctional growth towards 50.0% fibo at 3451.0. After completing the correction, the instrument may start a new descending structure to reach the low at 3310.6 or even break it. Later, the market may continue the mid-term downtrend with the target at 23.6% fibo (3258.9).
Forecasts presented in this section only reflect the author’s private opinion and should not be considered as guidance for trading. The Traders Spread bears no responsibility for trading results based on trading recommendations described in these analytical reviews.
Don’t miss the latest news and discussion on our Telegram channel. Subscribe today!


