
EURUSD, “Euro vs US Dollar”
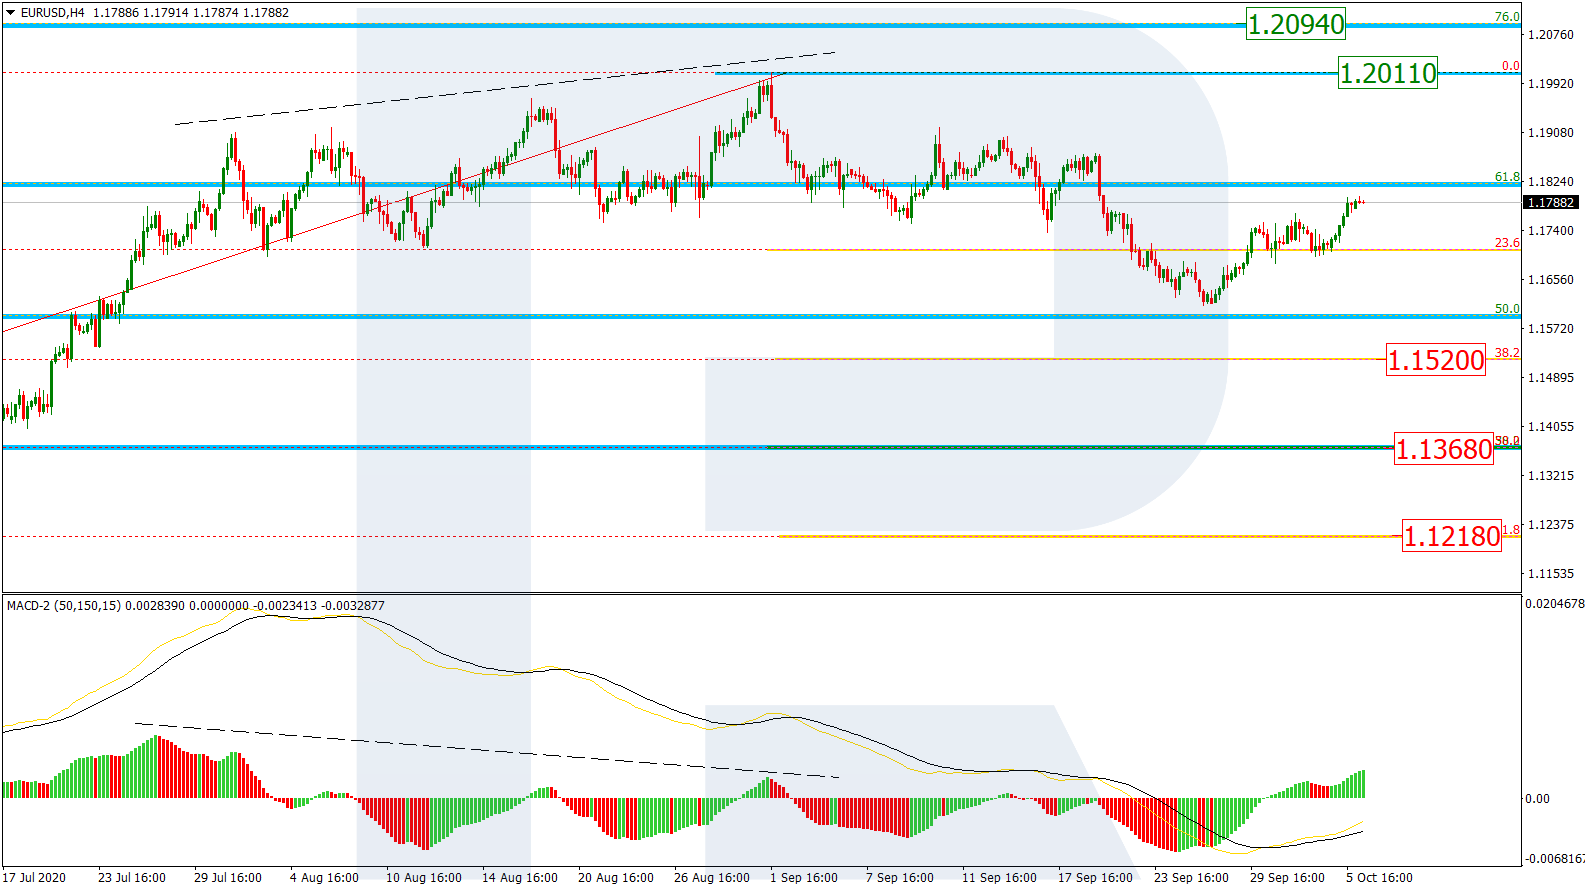
As we can see in the H4 chart, after a breakout of 23.6% fibo and a local convergence on MACD, the pair is correcting upwards. The structure of this movement implies the asset may reach the high at 1.2011, break it, and then continue growing towards the long-term 76.0% fibo at 1.2094. However, despite pretty stable growth, one shouldn’t exclude a possibility of another descending impulse. After completing the pullback, the pair may head 38.2%, 50.0%, and 61.8% fibo at 1.1520, 1.1368, and 1.1218 respectively.
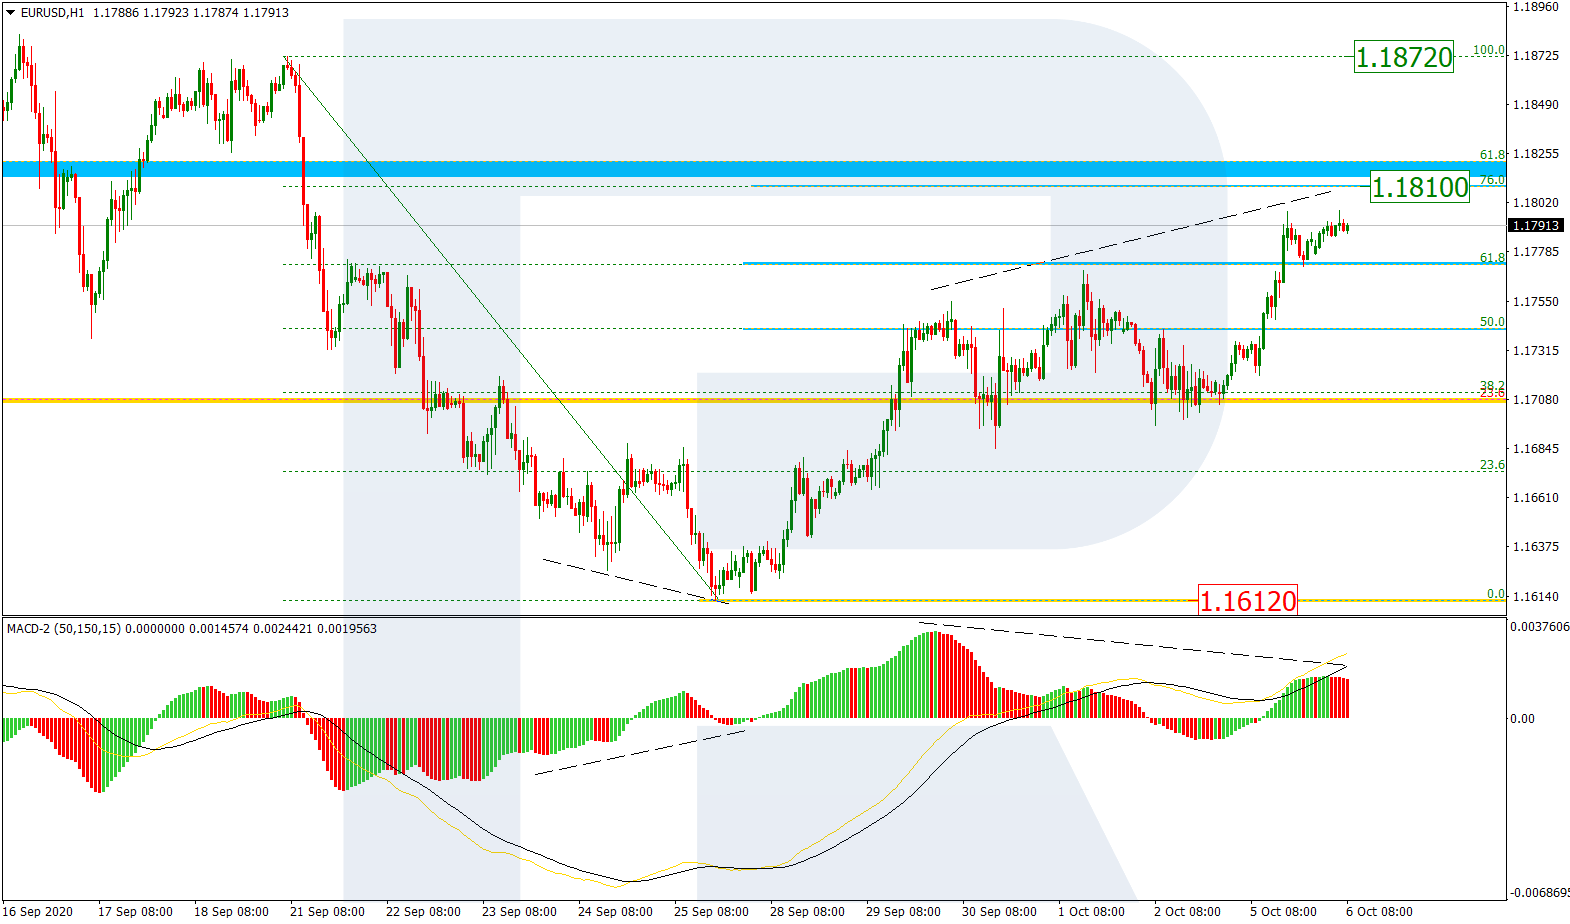
The H1 chart shows a wave to the upside after a convergence, which is heading towards 76.0% fibo at 1.1810. If the asset breaks this level and then the fractal level at 1.1872, the price may start another mid-term ascending wave. The support remains at the low at 1.1612.
USDJPY, “US Dollar vs. Japanese Yen”
As we can see in the H4 chart, after completing the descending correction, USDJPY is growing to reach its previous local high. If the price breaks it, the market may continue trading upwards to reach 38.2%, 50.0%, and 61.8% fibo at 106.24, 106.92, and 107.61 respectively. The support is the low at 104.00.

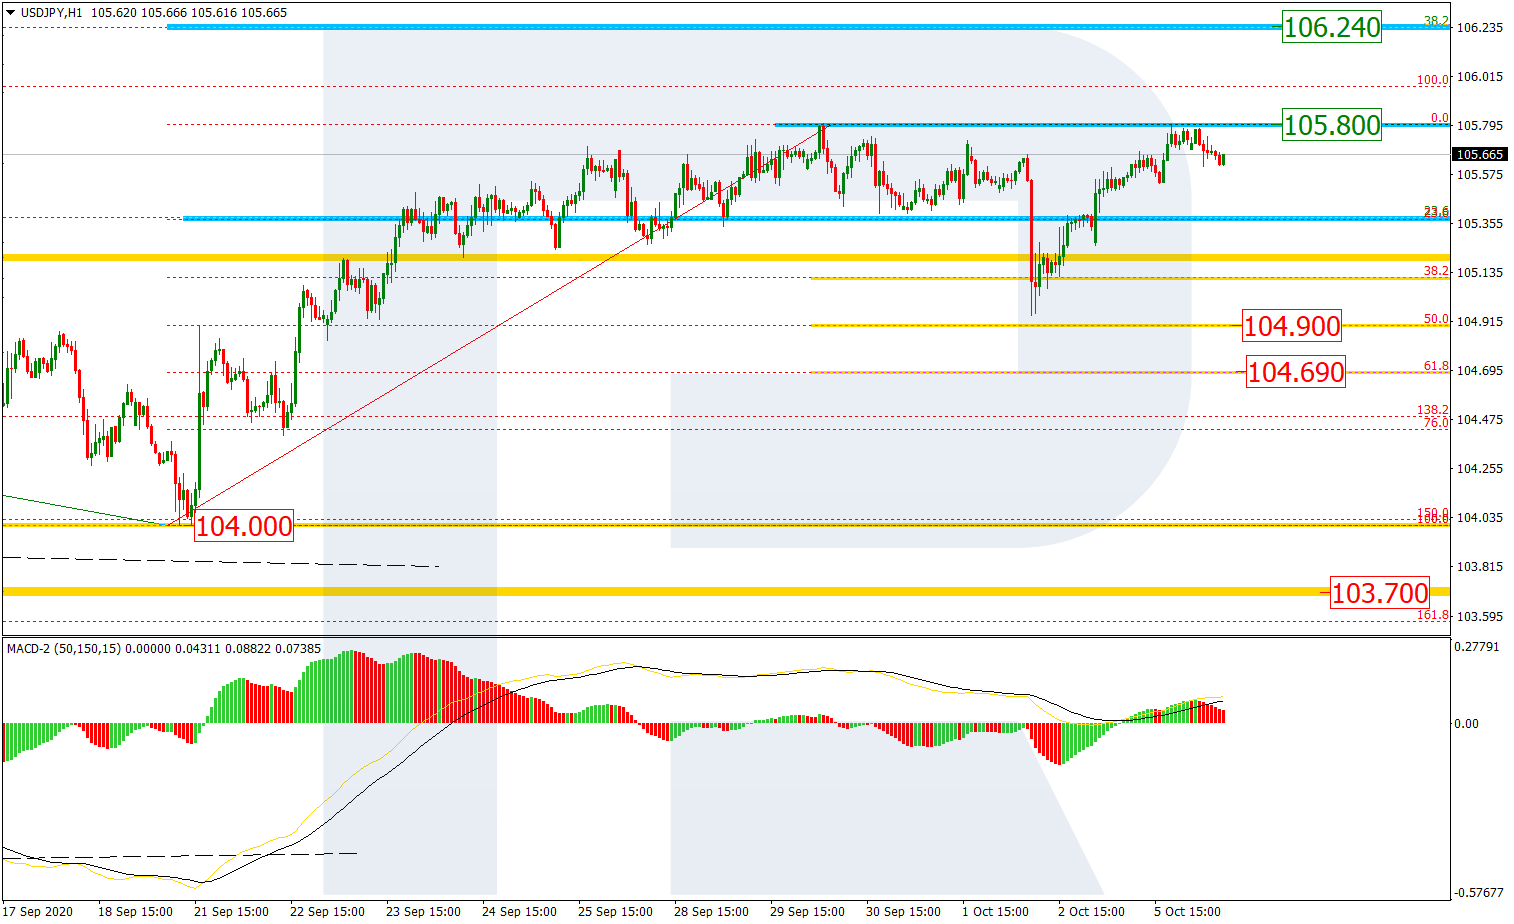
The H1 chart shows a more detailed structure of the wave to the upside after the price finished the pullback towards 38.2% fibo. The wave has almost reached the high at 105.80, a breakout of which may lead to further growth towards the mid-term 38.2% fibo at 106.24. However, another scenario implies that the instrument may rebound from the high and form a new descending correctional structure with the targets at 50.0% and 61,8% fibo at 104.90 and 104.69 respectively.
Forecasts presented in this section only reflect the author’s private opinion and should not be considered as guidance for trading.


