
EURUSD, “Euro vs US Dollar”
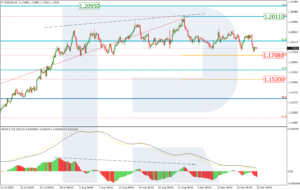
As we can see in the H4 chart, the divergence made the pair reverse after testing the resistance at 1.2000 and start a new correction. At the moment, the pair is heading towards 23.6% fibo at 1.1708 and may later continue falling to reach 38.2% fibo (1.1520). However, if EURUSD breaks the high at 1.2011, it may continue trading upwards to reach the long-term 76.0% fibo at 1.2095.
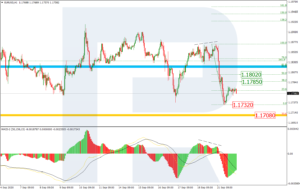
The H1 chart shows a local pullback after a quick descending impulse; it has already reached23.6% fibo but may later continue moving towards 38.2% and 50.0% fibo at 1.1785 and 1.1802 respectively. However, if the price breaks the local low at 1.1732, the asset may fall and reach 23.6% fibo at 1.1708.
USDJPY, “US Dollar vs. Japanese Yen”
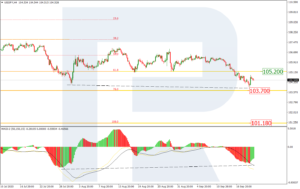
As we can see in the H4 chart, after breaking 61.8% fibo and attempting to reach 76.0% fibo at 103.70, the downtrend is slowing down. If the pair tests and breaks the latter level, the instrument may continue falling towards the fractal low at 101.18. In the nearest future, the market is expected to correct to reach 61.8% fibo at 105.20.
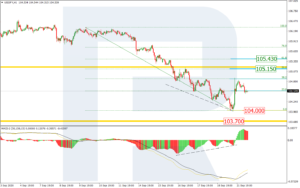
The H1 chart shows that the asset has completed a quick correctional wave to the upside after the convergence, which has reached 38.2% fibo. Later, the price may continue moving towards 50.0% and 61.8% fibo at 105.15 and 105.43 respectively. If the price breaks the low at 104.00, the downtrend will continue.
Forecasts presented in this section only reflect the author’s private opinion and should not be considered as guidance for trading.
Don’t miss the latest news and discussion on our Telegram channel. Subscribe today!


