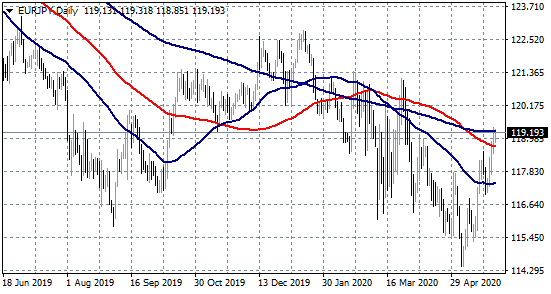
EURJPY retreat today after four consecutive days of gains as the common currency attracts bids on the E.U. Commission proposal on the common recovery fund. The Commission proposal includes 250 billion in loans and 500 billion in grants to the worst affected European countries by the coronavirus crisis.
On the economic data today, the Japan Housing Starts came in at -12.9% below the forecasts of -12.1% in April. The Annualized Housing Starts came down to 0.797M in April from 0.905M in March, while the Japan Construction Orders came in at -14.2% in April from the previous -14.3%. The Japan Industrial Production came in at -9.1%, below the expectations of -5.1% in April, the yearly reading for the Industrial Production came in at -14.4%, below the forecasts of -7.9%.
Consumer Confidence Index in Japan registered in at 24 topping the forecasts of 12.8 in May.
From Europe, France’s first quarter-final GDP came in at -5.3% better than expectations of -5.8%. The France consumer spending came down to -20.2% in April; the March reading was at -14.7%.
EURJPY Technical Analysis
On the technical side, the pair managed to break above the 50-day moving average on Monday, and that attract more bulls. The mini-rally also breached above the 100-day moving average and stalled yesterday and today at the 200-day moving average.
On the upside, strong resistance will be met at 119.25 – 119.32 area (200-day moving average and daily high). A move above might test the next resistance at 119.69 the high from March 31.
On the other side, initial support for the pair stands at 118.85, the daily low. A break below might test the critical 100-day moving average at 118.71. If EURJPY breaks below, then the next support is at 117.71 the low from May 27.

