

Corn Technical Analysis Report 23 December, 2020

  • Corn broke key resistance level 438.50
  • Likely to rise to 450.00

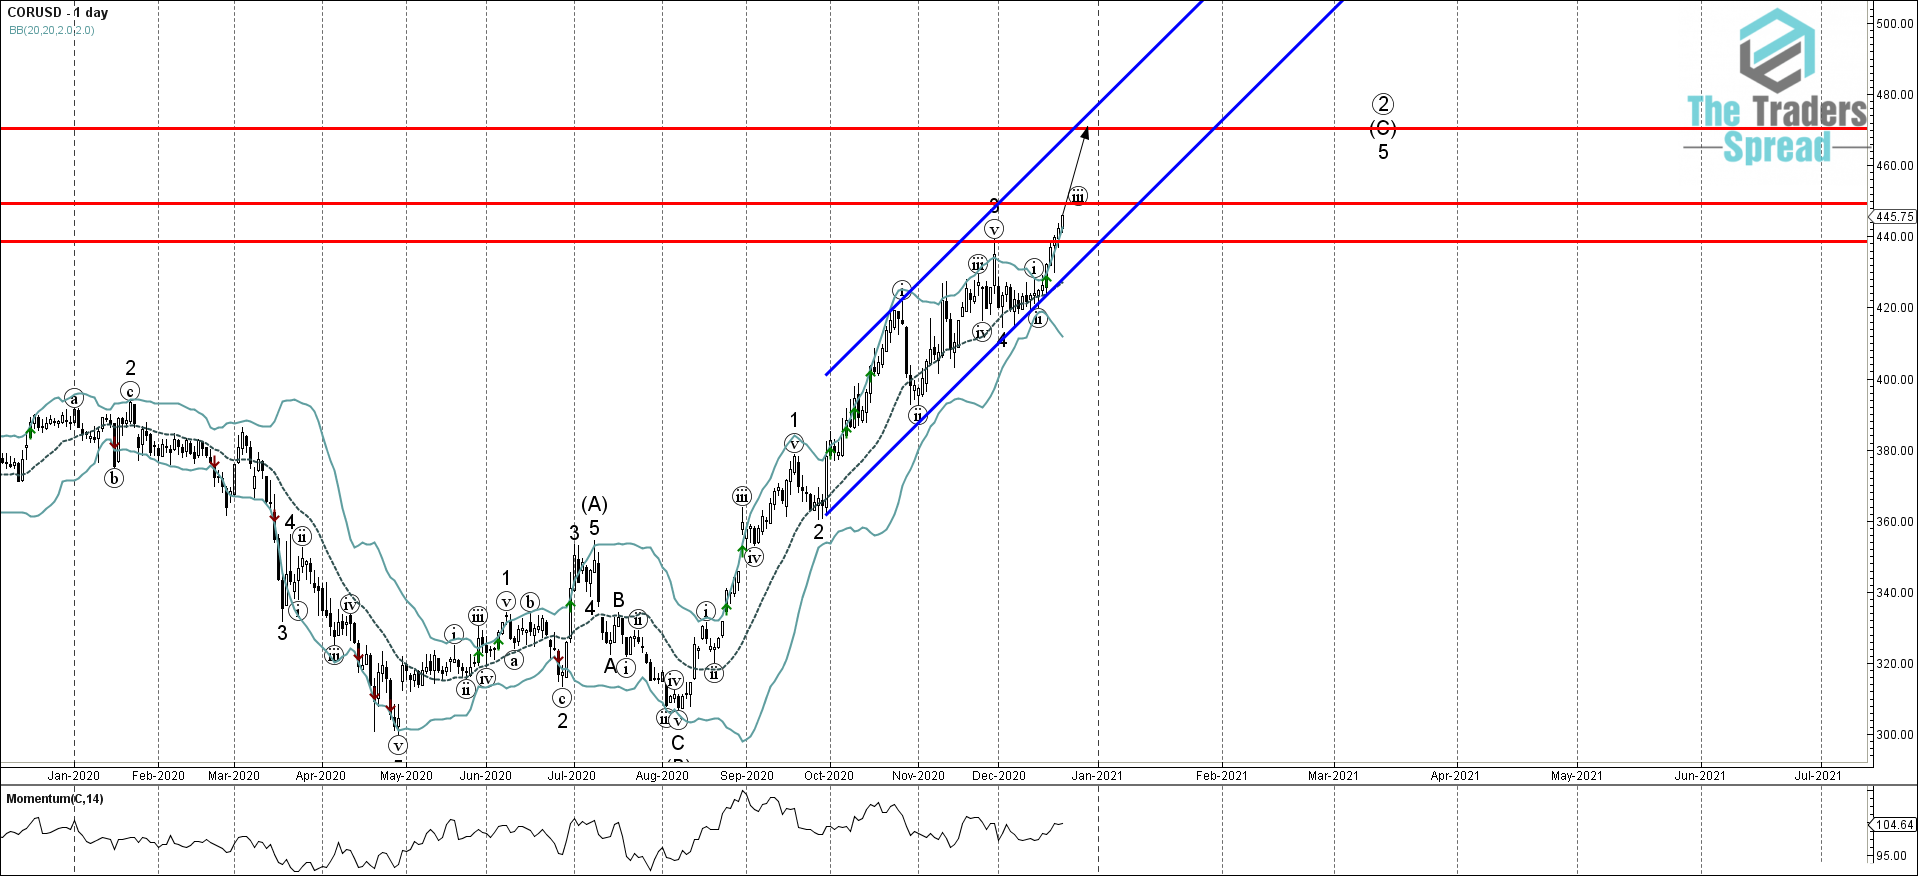
Corn continues to rise after the price broke above the key resistance level 438.50 (which previously stopped the sharp upward impulse wave 3 at the end of November as can be seen from the daily Corn chart below). The breakout of the resistance level 438.50 accelerated the active impulse waves 5 and (C), which belong to the long-term ABC correction ② from last year.

Given the clear uptrend that can be seen on the daily charts and the expectation of continued increase of demand from European countries (on the expectation of soon end to the epidemic on mass vaccination) –   Corn is likely to rise further toward the next resistance level 450.00 (target for the completion of the active impulse wave (iii)) – followed by the resistance level 470.00.

TOP BROKERS

Latest News

The multi-regulated CFD broker with 180+ products BRIEF INTRODUCTION The Vantage Group of Companies was incorporated in 2009 by a

A comprehensive analysis of an award-winning broker BRIEF INTRODUCTION Samtrade FX is incorporated in Saint Vincent and the Grenadines under

The Israeli-based multi-asset company with 2000+ products BRIEF INTRODUCTION Plus500 is a trademark of Plus500 Limited, an Israel incorporated firm

BRIEF INTRODUCTION Pepperstone, founded by Owen Kerr and Joe Davenport, is an FX and CFD broker based out of Melbourne,

An in-depth analysis of the top Australian forex broker Introduction to the top CFD broker IG Markets Ltd is the

The tier-I regulated broker with the lowest spreads in the industry BRIEF INTRODUCTION IC Markets is the trading name of