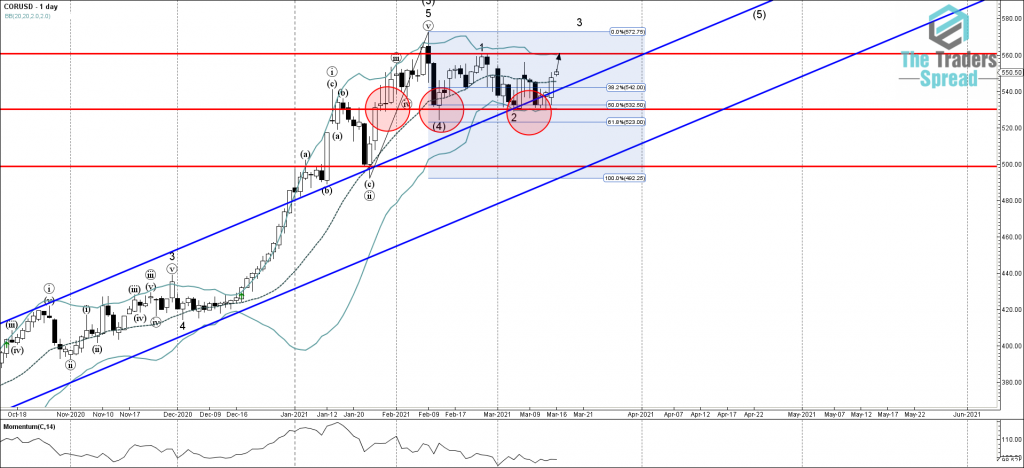
• Corn reversed from support area
• Likely to rise to resistance level 560.00
Corn recently reversed from the support area lying between the pivotal support level 530.00 (former resistance, which has been reversing the price from January, as can be seen from the daily Corn chart below), lower daily Bollinger Band, 50% Fibonacci correction of the upward impulse from the start of this year and the upper trendline of previously broken up channel from last year. The upward reversal from this support area started the active short-term impulse sequence 3.
Given the clear daily uptrend – Corn can be expected to rise further in the active impulse wave 3 toward the next resistance level 560.00 (top of the previous upward impulse wave 1 from the end of February).

