
- Corn broke support area
- Likely to fall to 415.00
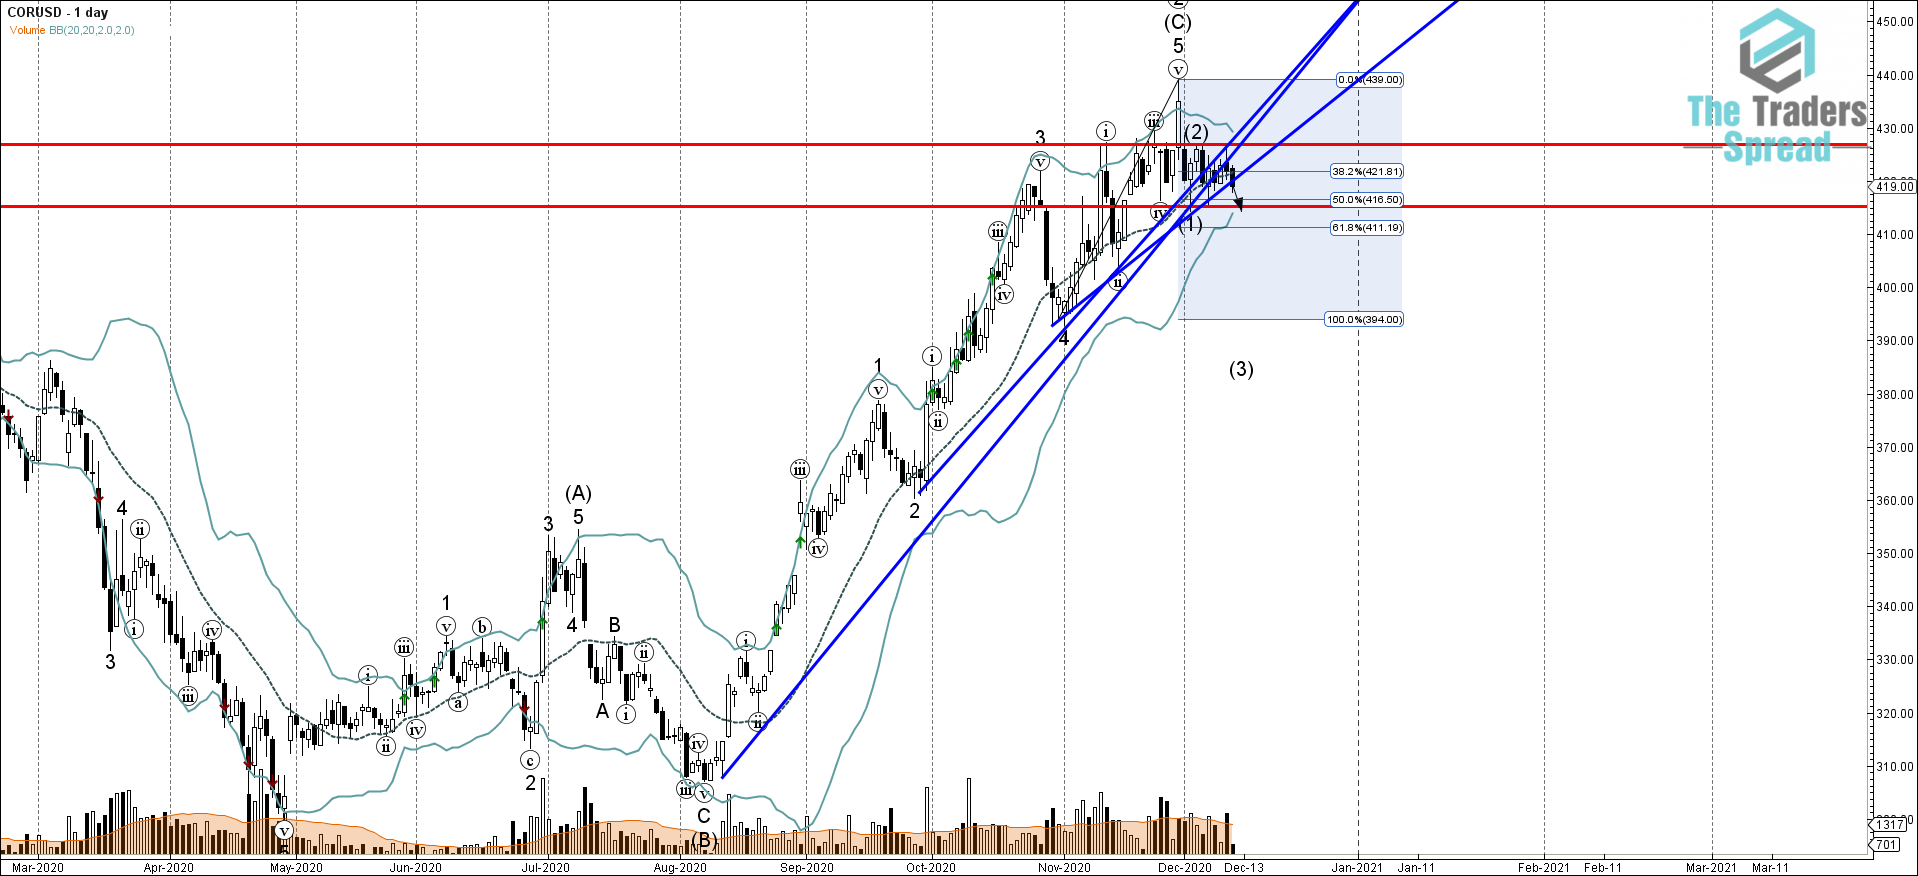
Corn recently broke the combined support area lying at the intersection of the multiple upward sloping support trendlines from August, October and September as can be seen from the daily Corn chart below. The breakout of these support trendlines coincided with the breakout of the 38.2% Fibonacci correction of the upward price impulse from the end of October – which added to the bearish pressure on Corn- accelerating the active impulse wave (3).
Given the strength of the nearby resistance level 427.00 (which reversed the previous waves (i), (ii) and (2)) – Corn is expected to fall further toward the next support level 415.00 (low of the previous impulse wave (1) from the start of this month).
Was this post helpful?
Let us know if you liked the post. That’s the only way we can improve.


