• Copper reversed from resistance area
• Likely to fall to support level 446.25
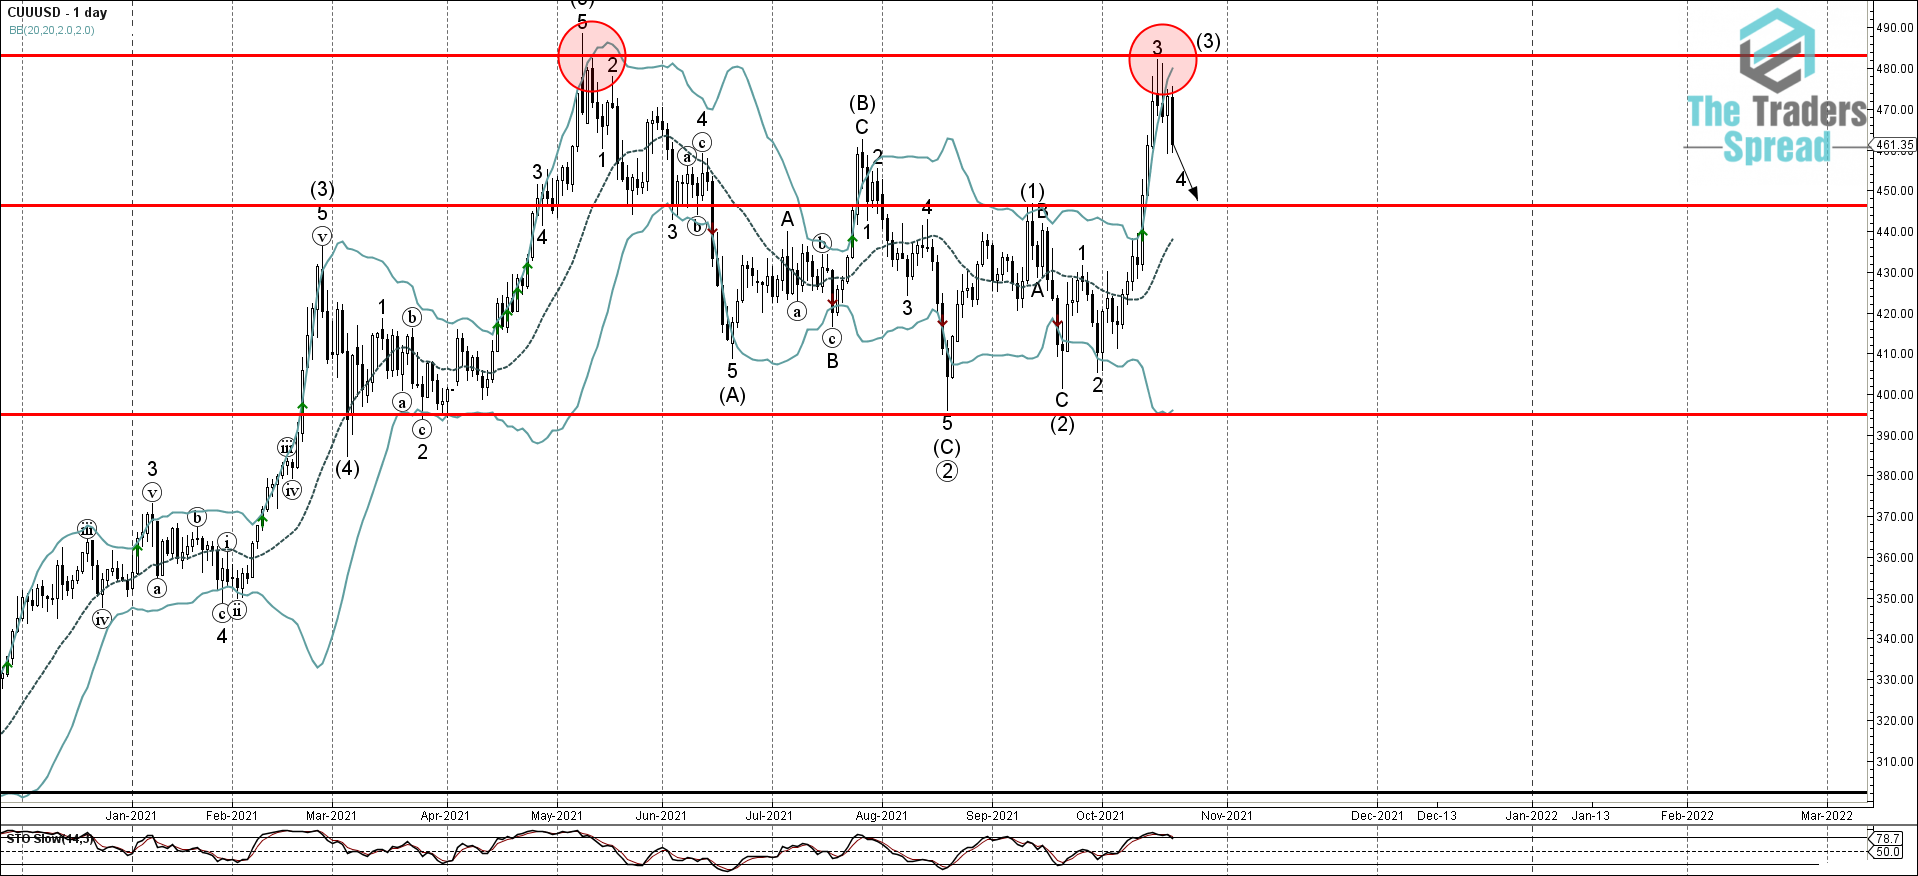
Copper recently reversed down from the combined resistance area located between the long-term resistance level 483.21 (which stopped the previous sharp uptrend at the end of May as can be seen from the daily Copper chart below) and the upper daily Bollinger Band. The downward reversal from this resistance zone stopped the previous short-term impulse wave 3.
Given the strongly of the aforementioned resistance area and the worsening of the risk sentiment seen across the commodities markets today, Copper can be expected to fall further toward the next support level 446.25 (previous monthly high from September, target for the completion of wave 4).
Was this post helpful?
Let us know if you liked the post. That’s the only way we can improve.