
Copper — the industrial metal that wires every grid, motor and data centre on earth — closed at $6.59 a pound ($14,519 a tonne) on COMEX on 27 August 2026, days after setting an all-time high. The comfortable story about that record is that it is an American accounting quirk: tariff-front-running has sucked metal into US warehouses, and when Washington finally rules, the hoard unwinds and the price deflates. That story is half right and wholly misleading. It explains the gap between New York and London. It does not explain why the shortage is worst in the places tariffs cannot reach.
Here is what almost nobody is pricing correctly. The refined-metal market and the concentrate market are telling opposite stories, and the equity market has already decided which one is lying. CRU still carries a forecast 639,000-tonne refined surplus for 2026 — a glut. Yet treatment and refining charges, the fee miners pay smelters to process ore, collapsed to about −$126.80 per dry metric tonne by end-June 2026 against a $0 annual benchmark, meaning smelters are now paying miners for the privilege of feedstock. A surplus market does not do that. Meanwhile Southern Copper has returned +133.7% and Freeport-McMoRan +78.8% over the past twelve months against copper’s +44.5%. Equity investors are underwriting a structurally higher copper price than the forward curve admits.
Key facts
- COMEX front-month copper touched a record $6.7775/lb (about $14,940/t) intraday on 26 August 2026 before retreating 1.6% — MINING.COM/Bloomberg, 26 August 2026.
- LME three-month copper traded at $14,350/t on 26 August, shy of the all-time intraday peak of $14,527.50 set in January 2026 — MINING.COM, 26 August 2026.
- Treatment and refining charges fell to roughly −$126.80/dmt by end-June 2026 versus a $0 annual benchmark — smelters are paying miners for concentrate.
- The global market lost about 338,000 tonnes of mine production in the first half of 2026 to disruptions in Indonesia, the DRC and Chile — consultancy Project Blue, cited 26 August 2026.
- COMEX inventories sit at a record above 675,000 tonnes after 46 consecutive daily builds, while LME stocks fell for a 42nd straight day to 204,975 tonnes on 14 August — the longest run of declines since 2014.
- Chile produced 5.415 million tonnes last year against its 2018 peak of 5.831 million, with permitting averaging 147 approvals per project — MINING.COM, 14 August 2026.
- The IMF’s global copper price averaged $13,542.82/t in July 2026 — FRED series PCOPPUSDM.
What is actually driving the copper price right now?
Two separate squeezes are running at once, and conflating them is the most common analytical error in the market. The first is American and artificial. The second is global and structural.
The American squeeze is a tariff trade. Washington missed its 30 June 2026 deadline for a ruling on refined copper imports and has not set a new date. With a duty possible but unscheduled, traders have spent months shipping metal into the United States to sit inside the tariff wall before it goes up. The result is the record COMEX stockpile above 675,000 tonnes, built over 46 consecutive daily increases, and a persistent premium of New York over London that reached roughly $400 a tonne in mid-August. None of that metal is consumed. It is parked.
The global squeeze is the one that matters for the 2027 price. Every tonne shipped to a US warehouse is a tonne removed from the pool that the rest of the world draws on. LME inventories fell for 42 consecutive sessions to 204,975 tonnes on 14 August, the longest run of declines since 2014, and nearly half of what remained was already earmarked for withdrawal. The cash-to-three-month spread blew out to $434 a tonne, a five-year high, and the August-September spread hit $370 — the widest one-month spread since the 2021 squeeze that forced the exchange into emergency intervention. Backwardation of that severity is not a positioning signal. It is the physical market reporting that prompt metal cannot be found.
Supply is not answering. The Democratic Republic of Congo banned concentrate exports, Chinese smelters cut output on tight feedstock, and Project Blue counts roughly 338,000 tonnes of first-half mine production lost to setbacks in Indonesia, the DRC and Chile. Writing for Reuters, columnist Andy Home argued that the market’s violent reaction to the Congo ban — which touches less than a fifth of that country’s copper output — revealed more than the policy did: “The real news here is not Congo’s long-standing ambition to move down the value chain, but copper’s acute sensitivity to any sign of supply disruption.” If LME stocks keep draining east and west, he warned, “Doctor Copper’s panic attack is unlikely to be the last.” Traders following the same tightness across the metals complex will recognise the pattern from our coverage of the silver rally and the gold-silver ratio.
Who is responding, and how
The sell side has spent 2026 revising upward and still trailing the tape. BMI raised its full-year average forecast to approach $13,500 a tonne from $12,700 — an increase published while spot was already trading above $14,000. The research house framed Washington’s decision as the immediate directional catalyst, noting that a phased approach of 15% from 2027 and 30% from 2028 would lend further support, while another walk-back would pressure prices given the record American stockpile. Its conclusion was that the outcome “does not materially alter our outlook, leaving copper’s longer-term supportive fundamentals largely intact”.
Analysts closest to the physical trade are more direct. Robert Edwards, principal copper analyst at CRU, told Reuters in late August that his own house forecast may already be obsolete: “If imports keep coming in as they have been, then it’s going to look like a deficit market in reality.” That is the 639,000-tonne surplus being quietly downgraded to balanced by the person who models it. Amelia Fu of Bank of China International expects “new record highs in copper prices in coming weeks or months”. On the other side, Alice Fox, a strategist at Macquarie, points out that the record COMEX stockpile will take “years” to be consumed — the strongest bear argument available, and a real one.
Producers are behaving like people who expect scarcity to persist. Antofagasta trimmed production guidance by about 5% despite a 72% jump in first-half profit, still absorbing the cost of July storms that halted Los Pelambres. Codelco confirmed the stalled Andes Norte project at El Teniente will not reach production until 2029. Chile has now convened a public-private group to accelerate permitting and help finance junior miners, an admission that national output stuck near 5.5 million tonnes against a 2018 peak of 5.831 million is a policy problem, not a price problem.
The clearest verdict is in the equity tape. Southern Copper’s market value of nearly $181 billion edged it past Rio Tinto at about $180 billion in late August, making it the world’s second most valuable miner behind BHP for the first time. Investors do not pay that multiple for a metal they expect to mean-revert.
The numbers: what the market is actually pricing
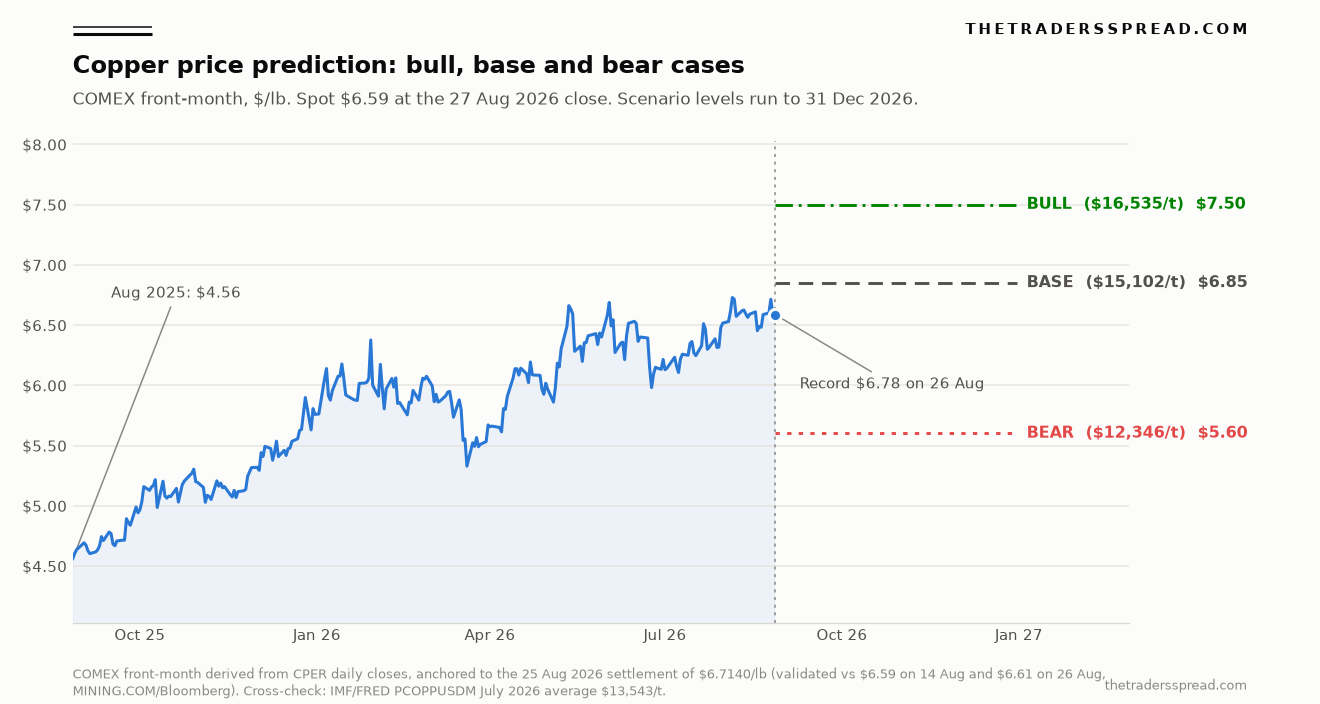
A note on the spot figure, because copper is quoted in three places at once and the numbers disagree. COMEX front-month is the reference used throughout this analysis. Its last confirmed dated prints were a record $6.7775/lb intraday and a retreat to $6.6070 on 26 August, after a record settlement of $6.7140 on 25 August. Deriving the 27 August close from the daily path of the United States Copper Index Fund, anchored to that 25 August settlement, gives $6.59/lb ($14,519/t) — a method that reproduces the independently reported $6.59 on 14 August and $6.61 on 26 August to within 0.13%. The IMF’s monthly global average for July, $13,542.82/t, is the slower cross-check.
| Instrument | 27 Aug 2026 | 12-month change | 52-week range |
|---|---|---|---|
| COMEX copper, front-month | $6.59/lb ($14,519/t) | +44.5% | $4.51 – $6.75/lb |
| LME copper, three-month | $14,350/t (26 Aug) | +15% year-to-date | peak $14,527.50 (Jan 2026) |
| Southern Copper (SCCO) | $216.28 | +133.7% | $89.41 – $220.78 |
| Freeport-McMoRan (FCX) | $78.42 | +78.8% | $35.15 – $80.24 |
Read those four rows together and the synthesis is hard to avoid. The metal is up 44.5% in a year. The two largest listed pure-play producers are up 133.7% and 78.8% — betas of roughly 3.0 and 1.8 to the underlying. Equity markets are not trading a tariff distortion that unwinds in a quarter; they are capitalising a higher long-run copper price into terminal value. The same demand thesis that has repriced copper miners runs through the AI build-out we covered in Nvidia’s Q3 guidance: every gigawatt of data-centre capacity is thousands of tonnes of copper in busbars, transformers and cabling, and that demand is price-inelastic in a way construction demand never was.
The contrary evidence is genuine and sits in the same table. Shanghai Futures Exchange copper trades near 109,000 yuan a tonne, with Jinrui Futures pegging support at 106,000 yuan (about $15,770). The LME cash-to-three-month spread has already unwound from more than $500 to $127 at the 25 August settlements, and the September-October spread of about $100 signals prompt tightness easing rather than intensifying. A squeeze that is relaxing while inventories elsewhere sit at record highs is not a launchpad.
The regulatory and structural tension
Everything above resolves into one binary that no analyst controls: the White House ruling on refined copper imports, now nearly two months past its own deadline. The Section 232 process has already achieved most of its market effect without producing a decision, which is the unusual part. A phased tariff — the 15%-from-2027, 30%-from-2028 structure that research houses including ING and Société Générale treat as a base case — would validate the inventory build and keep the American premium alive into 2027. An outright walk-back would strand 675,000 tonnes of metal that was shipped for a reason that no longer exists, and the arbitrage would reverse violently.
The London Metal Exchange carries its own structural risk. The 2021 nickel crisis and the exchange’s subsequent intervention established that the LME will suspend or unwind trading when spreads become disorderly, and August’s $434 cash-to-three-month backwardation was described by the market as the worst since exactly that episode. Any repeat brings the possibility of intervention into the price, which caps the upside in a way that pure fundamentals do not.
Further out, the constraint is permitting rather than geology. Chile’s 147 approvals per project, routinely exceeding a decade, is the reason a copper price that has doubled off its 2025 base has not produced a supply response. Codelco pushing El Teniente’s Andes Norte to 2029 is the same story in one asset. Currencies of major producer economies tend to track this cycle, which is why the copper trade and the commodity-linked FX trade are increasingly the same position — a dynamic we set out in the AUD/USD forecast. The full commodity desk is at our commodities coverage and the cross-asset dashboard at markets.
Copper price prediction: base, bull and bear cases
Spot reference is $6.59/lb ($14,519/t), the COMEX front-month close on 27 August 2026. All levels below run to 31 December 2026.
Base case — $6.85/lb ($15,102/t), roughly 50% probability. The tariff ruling lands late in the year in phased form, or slips again without resolution. The American premium persists, LME inventories stay historically thin without collapsing, and the concentrate deficit keeps a floor under the price while the record COMEX stockpile caps the melt-up. Copper grinds 4% higher and spends the fourth quarter making marginally higher highs, which is broadly what it has done since February.
Bull case — $7.50/lb ($16,535/t), roughly 25% probability. Requires two things together: a confirmed tariff with a near-term start date, and LME on-warrant stocks breaking below the roughly 100,000-tonne level at which the exchange’s deliverable pool stops functioning as a buffer. Add a fresh disruption at a top-ten mine and Amelia Fu’s “new record highs” arrives quickly. That is a 13.9% move from spot — smaller than the 44.5% the metal has already delivered in a year.
RelatedUranium Price Prediction: $118 Bull Case vs $68 Bear Case
Bear case — $5.60/lb ($12,346/t), roughly 25% probability. Washington walks away from copper tariffs entirely. The 675,000-tonne COMEX hoard becomes freely exportable, the New York premium collapses toward zero, and metal floods back into LME and Shanghai warehouses. Alice Fox’s “years” of stockpile absorption becomes the dominant fact, and a Chinese demand disappointment on top of it would do the rest. A 15% drawdown would still leave copper 23% above where it traded in August 2025.
What would change my mind. On the bullish side: LME on-warrant stocks below 100,000 tonnes, or treatment charges staying below −$100/dmt into the 2027 benchmark negotiations, would confirm that the concentrate deficit is structural rather than a one-year disruption artefact. On the bearish side: a definitive no-tariff ruling, or Chinese smelter output recovering while COMEX inventories keep building, would mean the surplus CRU forecast is real and merely displaced. The single cleanest invalidation of the whole bullish structure is a sustained COMEX close below $5.90, which would signal the New York premium is unwinding ahead of an announcement.
Frequently asked questions
Why is the copper price at a record in 2026?
Two squeezes overlap. Traders shipped metal into the United States ahead of a possible import tariff, building a record COMEX stockpile above 675,000 tonnes and draining supply elsewhere. Simultaneously, mine disruptions in Indonesia, the DRC and Chile removed about 338,000 tonnes of first-half output, pushing treatment charges deeply negative and tightening the concentrate market independently of tariffs.
What is the difference between the COMEX and LME copper price?
COMEX is the US futures contract and LME is the global benchmark. Because tariff risk applies only to metal entering the United States, COMEX has traded at a premium — roughly $400 a tonne in mid-August 2026. That gap is a tariff expectation, not a quality difference, and it would compress rapidly if Washington ruled against duties.
What are treatment and refining charges, and why do they matter?
TC/RCs are the fees miners pay smelters to turn concentrate into refined metal. They fall when ore is scarce relative to smelting capacity. At roughly −$126.80 per dry metric tonne by end-June 2026 against a $0 benchmark, smelters are effectively paying for feedstock — the clearest available signal that raw copper supply, not refined copper, is the binding constraint.
Could the copper price fall back below $6.00 a pound?
Yes, and the mechanism is identifiable. A definitive US decision against copper tariffs would strand the record COMEX inventory, collapse the New York premium and release metal back into global warehouses. Macquarie’s Alice Fox notes that stockpile would take years to absorb. A sustained COMEX close below $5.90 would be the early signal.
Does data-centre demand really move the copper price?
It is becoming material rather than dominant. Grid connections, transformers, busbars and cabling for AI data centres consume copper in volumes that are largely insensitive to price, because the metal is a small share of total project cost. That inelasticity matters more than the tonnage: it removes a demand brake that construction and manufacturing historically provided.
How reliable is a copper price forecast to December 2026?
Less reliable than usual, because a single unscheduled policy decision dominates the distribution. The scenarios here assign roughly 50% to the base case and 25% each to the bull and bear outcomes, which is an unusually wide spread. The tariff ruling date is therefore the primary variable to track, and these scenarios are revised on the announcement.
Disclaimer
This article is analysis and information only. It is not financial, investment or trading advice, and nothing in it is a recommendation to buy or sell any instrument. Commodity futures and CFDs are leveraged products carrying a high risk of rapid loss. Prices, levels and probabilities cited are as at 27–28 August 2026 and will change. Capital is at risk. Readers should conduct their own research and consider their circumstances before acting on any market information.