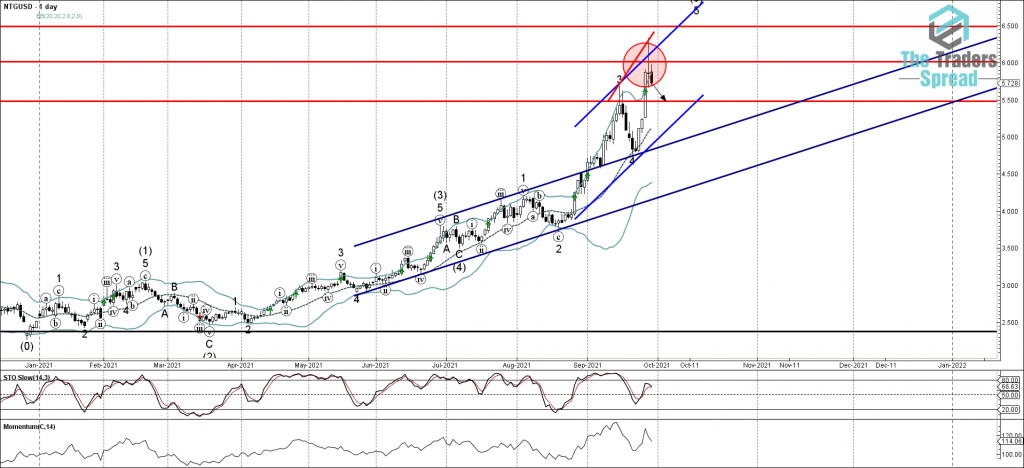
• Natural gas reversed from resistance zone
• Likely to fall to support level 5.500
Natural gas under the bearish pressure today after the price formed the daily Japanese candlesticks reversal pattern Shooting Star Doji near the resistance zone located between the key round resistance level 6.000, upper daily Bollinger Band and the resistance trendline of the daily up channel from the end of August. The downward reversal from this resistance zone stopped the previous impulse wave 5 – which belongs to the intermediate impulse wave (5) from the start of July.
Given the clear bearish divergence on the daily Stochastic indicator, Natural gas can be expected to fall further toward the next round support level 5.500 (previous resistance from the middle of September).


